which box - and - whisker plot represents the data set? 11, 6, 19, 14, 21, 7, 13, 15, 15
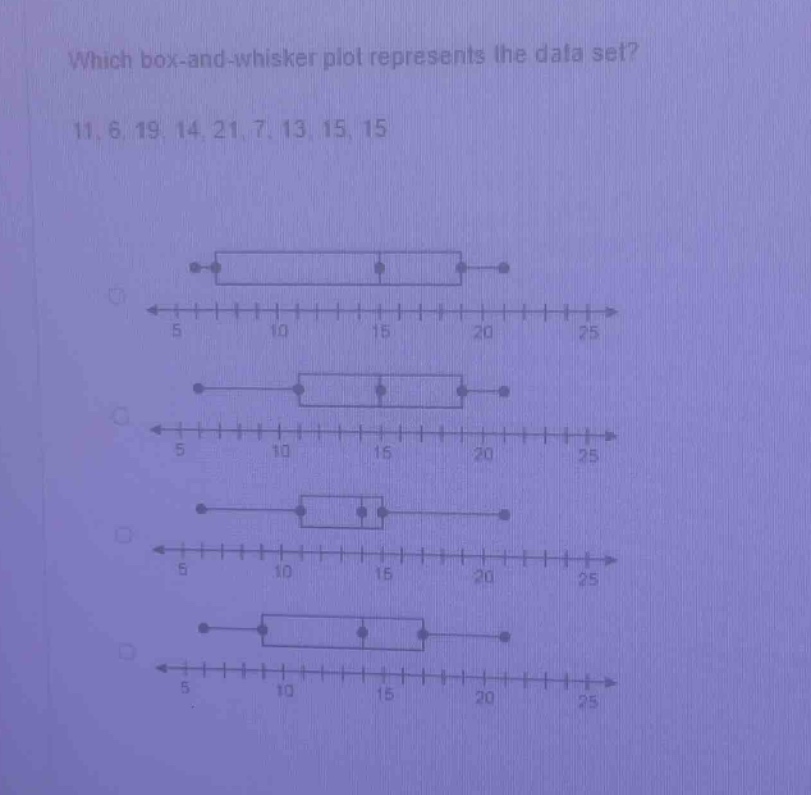
which box - and - whisker plot represents the data set? 11, 6, 19, 14, 21, 7, 13, 15, 15
Answer
Explanation:
Step1: Arrange data in ascending order
$6,7,11,13,14,15,15,19,21$
Step2: Find the minimum value
The minimum value is $6$.
Step3: Find the first - quartile ($Q_1$)
There are $n = 9$ data points. The position of $Q_1$ is $\frac{n + 1}{4}=\frac{9+1}{4}=2.5$. So, $Q_1=\frac{7 + 11}{2}=9$.
Step4: Find the median ($Q_2$)
The position of the median is $\frac{n + 1}{2}=\frac{9+1}{2}=5$. So, $Q_2 = 14$.
Step5: Find the third - quartile ($Q_3$)
The position of $Q_3$ is $\frac{3(n + 1)}{4}=\frac{3\times(9 + 1)}{4}=7.5$. So, $Q_3=\frac{15+19}{2}=17$.
Step6: Find the maximum value
The maximum value is $21$.
The box - and - whisker plot should have the left - most point (minimum) at $6$, the left - edge of the box ($Q_1$) at $9$, the line inside the box ($Q_2$) at $14$, the right - edge of the box ($Q_3$) at $17$, and the right - most point (maximum) at $21$.
Answer:
Based on the above - calculated values, you need to visually inspect the given box - and - whisker plots to find the one that matches these values. Without specific labels on the given plots, it's not possible to directly state which one is correct from the text description alone, but you can use the values of $6$ (min), $9$ ($Q_1$), $14$ ($Q_2$), $17$ ($Q_3$), and $21$ (max) to identify the correct plot.