which box - and - whisker plot represents the data set? 12, 10, 16, 19, 18, 14, 4, 18, 4
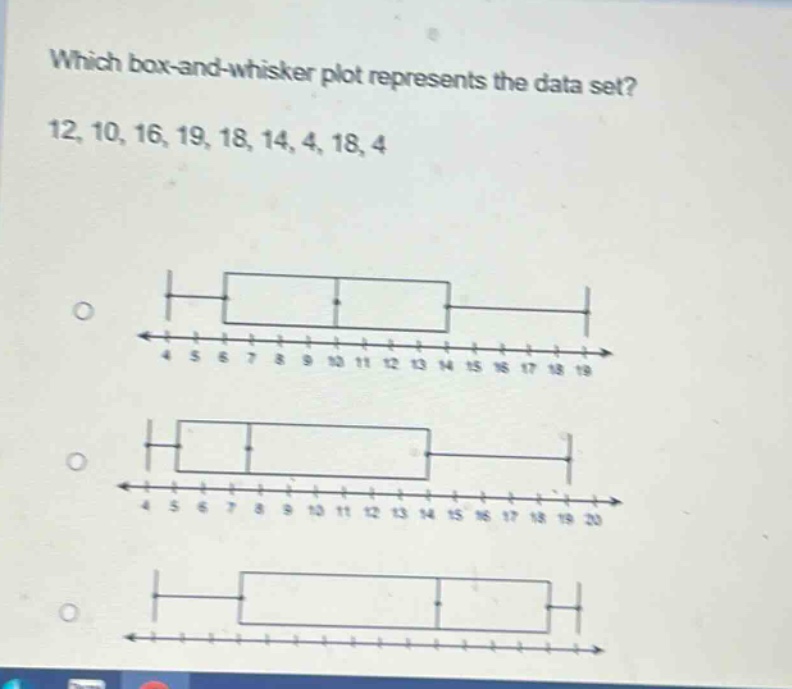
which box - and - whisker plot represents the data set? 12, 10, 16, 19, 18, 14, 4, 18, 4
Answer
Explanation:
Step1: Sort the data set
$4,4,10,12,14,16,18,18,19$
Step2: Find the minimum value
The minimum value is $4$.
Step3: Find the first - quartile ($Q_1$)
The lower half of the data is $4,4,10,12$. The median of the lower half ($Q_1$) is $\frac{4 + 10}{2}=7$.
Step4: Find the median ($Q_2$)
The median of the whole data set (since $n = 9$, the middle - value) is the 5th value, so $Q_2=14$.
Step5: Find the third - quartile ($Q_3$)
The upper half of the data is $16,18,18,19$. The median of the upper half ($Q_3$) is $\frac{18+18}{2}=18$.
Step6: Find the maximum value
The maximum value is $19$.
Answer:
The box - and - whisker plot should have the minimum value at 4, $Q_1$ at 7, the median at 14, $Q_3$ at 18, and the maximum value at 19. Without seeing the full set of options clearly, you would look for a box - and - whisker plot with these values marked correctly. The box starts at $Q_1 = 7$, ends at $Q_3=18$, has a line inside the box at the median $Q_2 = 14$, and the whiskers extend to the minimum 4 and maximum 19.