the box - and - whisker plot below represents some data set. what percentage of the data values are between…
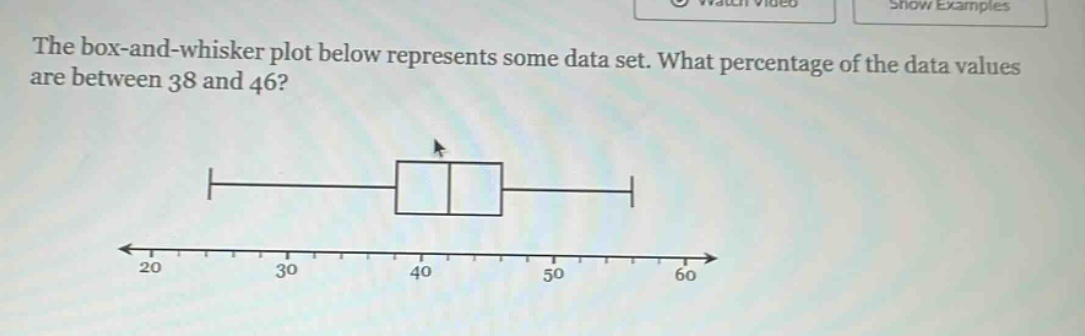
the box - and - whisker plot below represents some data set. what percentage of the data values are between 38 and 46?
Answer
Explanation:
Step1: Recall box - and - whisker plot properties
In a box - and - whisker plot, the box represents the inter - quartile range (IQR). The lower quartile ($Q_1$) is the value at the left - hand side of the box and the upper quartile ($Q_3$) is the value at the right - hand side of the box. The median is the line inside the box. The whiskers extend to the minimum and maximum non - outlier values.
Step2: Identify quartile values
Assume that the box starts at $Q_1$ and ends at $Q_3$. If we assume that the box starts at 38 (lower quartile $Q_1$) and 46 is the median. The lower half of the data is from the minimum value to the median. The inter - quartile range (the box) contains 50% of the data. The data from $Q_1$ to the median is half of the inter - quartile range data.
Step3: Calculate the percentage
Since the data from $Q_1$ to the median is half of the 50% of data in the IQR, the percentage of data values between $Q_1$ (38) and the median (46) is 25%.
Answer:
25%