the box - and - whisker plot below represents some data set. what percentage of the data values are between…
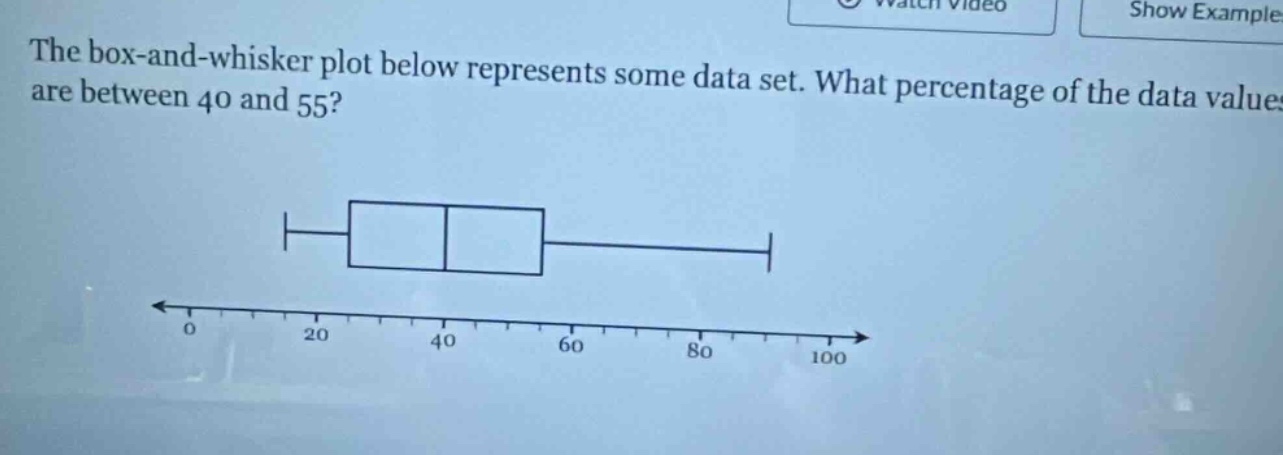
the box - and - whisker plot below represents some data set. what percentage of the data values are between 40 and 55?
Answer
Explanation:
Step1: Understand box - and - whisker plot
In a box - and - whisker plot, the box represents the inter - quartile range (IQR). The left side of the box is the first quartile ($Q_1$), the middle line of the box is the median ($Q_2$), and the right side of the box is the third quartile ($Q_3$). Here, 40 is $Q_1$ and 55 is $Q_2$.
Step2: Recall quartile percentage
The first quartile ($Q_1$) represents the 25th percentile and the median ($Q_2$) represents the 50th percentile.
Step3: Calculate the percentage
To find the percentage of data between $Q_1$ and $Q_2$, we subtract the percentile of $Q_1$ from the percentile of $Q_2$. So, $50 - 25=25$.
Answer:
25%