the box - and - whisker plot below represents some data set. what percentage of the data values are between…
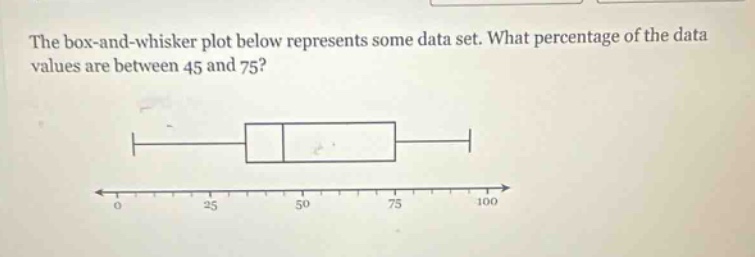
the box - and - whisker plot below represents some data set. what percentage of the data values are between 45 and 75?
Answer
Explanation:
Step1: Recall box - and - whisker plot properties
In a box - and - whisker plot, the box represents the inter - quartile range (IQR). The left - hand side of the box is the first quartile ($Q_1$) and the right - hand side is the third quartile ($Q_3$). The median is the line inside the box. The minimum value is the end of the left whisker and the maximum value is the end of the right whisker.
Step2: Identify quartile values
Assume that the box - and - whisker plot has the following properties: The left end of the box is $Q_1$, the right end of the box is $Q_3$. If we assume that the left end of the box is at 45 (i.e., $Q_1 = 45$) and the right end of the box is at 75 (i.e., $Q_3=75$). The inter - quartile range ($IQR$) contains 50% of the data. The formula for the inter - quartile range is $IQR = Q_3 - Q_1$. The data values between $Q_1$ and $Q_3$ represent 50% of the data set.
Answer:
50%