the box - and - whisker plot below represents some data set.\nwhat percentage of the data values are between…
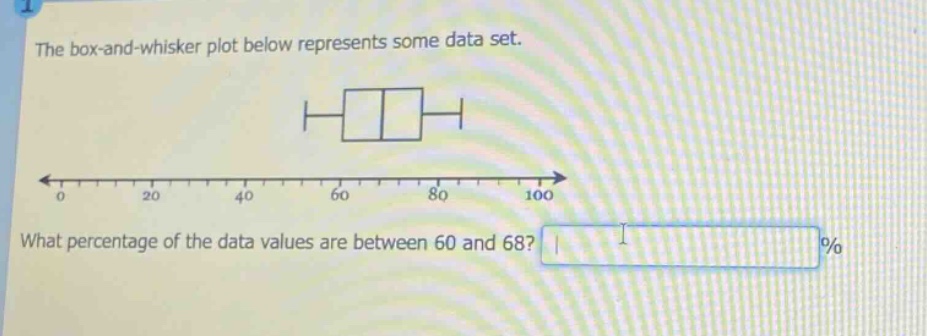
the box - and - whisker plot below represents some data set.\nwhat percentage of the data values are between 60 and 68? %
Answer
Explanation:
Step1: Recall box - and - whisker plot properties
In a box - and - whisker plot, the box represents the inter - quartile range (IQR), from the first quartile ($Q_1$) to the third quartile ($Q_3$). The median is the line inside the box. Here, assume the box starts at $Q_1$ and ends at $Q_3$. The entire box represents 50% of the data. If we assume the data within the box is uniformly distributed (a simplifying assumption for estimating percentages between values within the box), we first need to find the proportion of the box's length that the interval from 60 to 68 represents. Let's assume the box starts at 60 (left - hand side of the box) and ends at 80 (right - hand side of the box).
Step2: Calculate the length of the box and the sub - interval
The length of the box $L = 80 - 60=20$. The length of the sub - interval from 60 to 68 is $l = 68 - 60 = 8$.
Step3: Calculate the percentage
The percentage of data in the sub - interval is given by the formula $\text{Percentage}=\frac{l}{L}\times50%$. Substitute $l = 8$ and $L = 20$ into the formula: $\text{Percentage}=\frac{8}{20}\times50%$. $\frac{8}{20}\times50%=0.4\times50% = 20%$.
Answer:
20