the box - and - whisker plot below represents some data set. what percentage of the data values are greater…
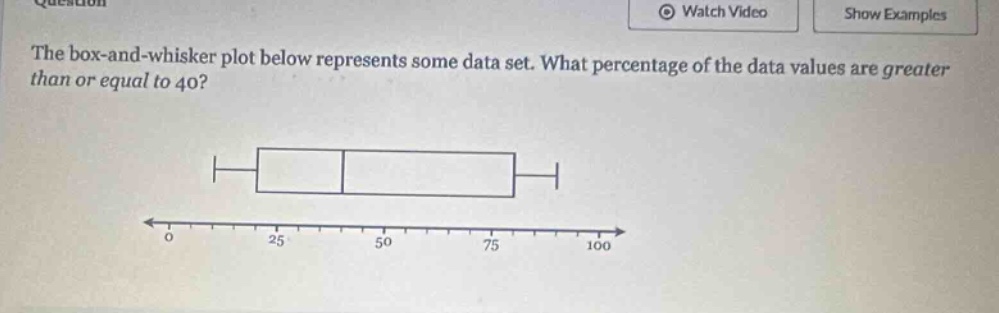
the box - and - whisker plot below represents some data set. what percentage of the data values are greater than or equal to 40?
Answer
Explanation:
Step1: Comprender la estructura del diagrama
En un diagrama de caja y bigotes, la caja representa el 50% del conjunto de datos. El límite inferior de la caja es el primer cuartil ($Q_1$) y el límite superior es el tercer cuartil ($Q_3$). El valor 40 está en el primer cuartil.
Step2: Calcular el porcentaje
El 25% de los datos está por debajo del primer cuartil y el 75% está por encima o igual al primer cuartil.
Answer:
75%