the box - and - whisker plot below represents some data set. what percentage of the data values are greater…
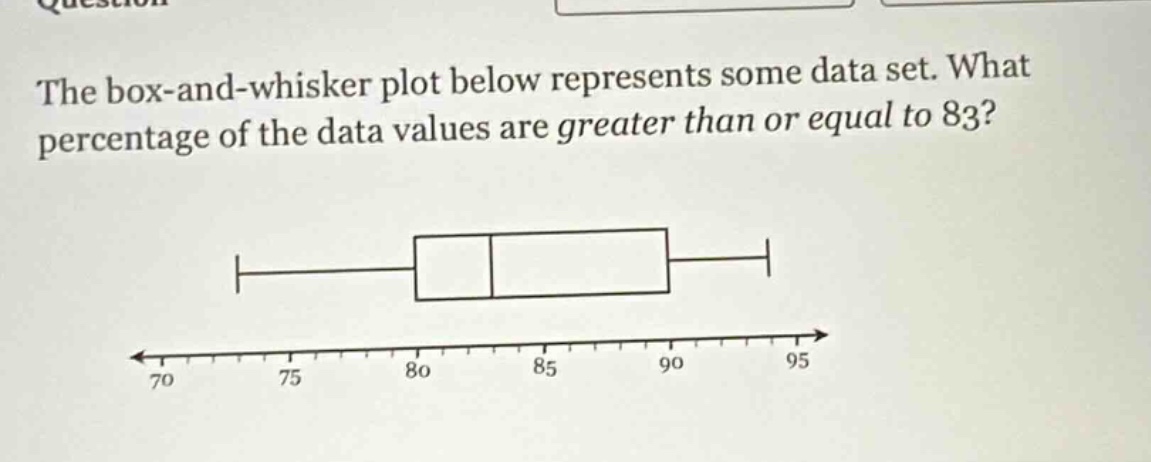
the box - and - whisker plot below represents some data set. what percentage of the data values are greater than or equal to 83?
Answer
Explanation:
Step1: Identify quartiles from the box plot
Q1 = 80, Q3 = 85 (box spans from 80 to 85).
Step2: Determine data distribution
25% of data ≤ Q1, 50% between Q1 and Q3, 25% ≥ Q3.
Step3: Calculate percentage ≥ 83
83 is within Q1-Q3 interval (80-85). Interval length = 5, 83-85 length = 2.
Percentage in Q1-Q3 portion: $\frac{2}{5} \times 50% = 20%$.
Add Q3-upper whisker percentage: $20% + 25% = 45%$.
Answer:
45%