the box - and - whisker plot below represents some data set. what percentage of the data values are less…
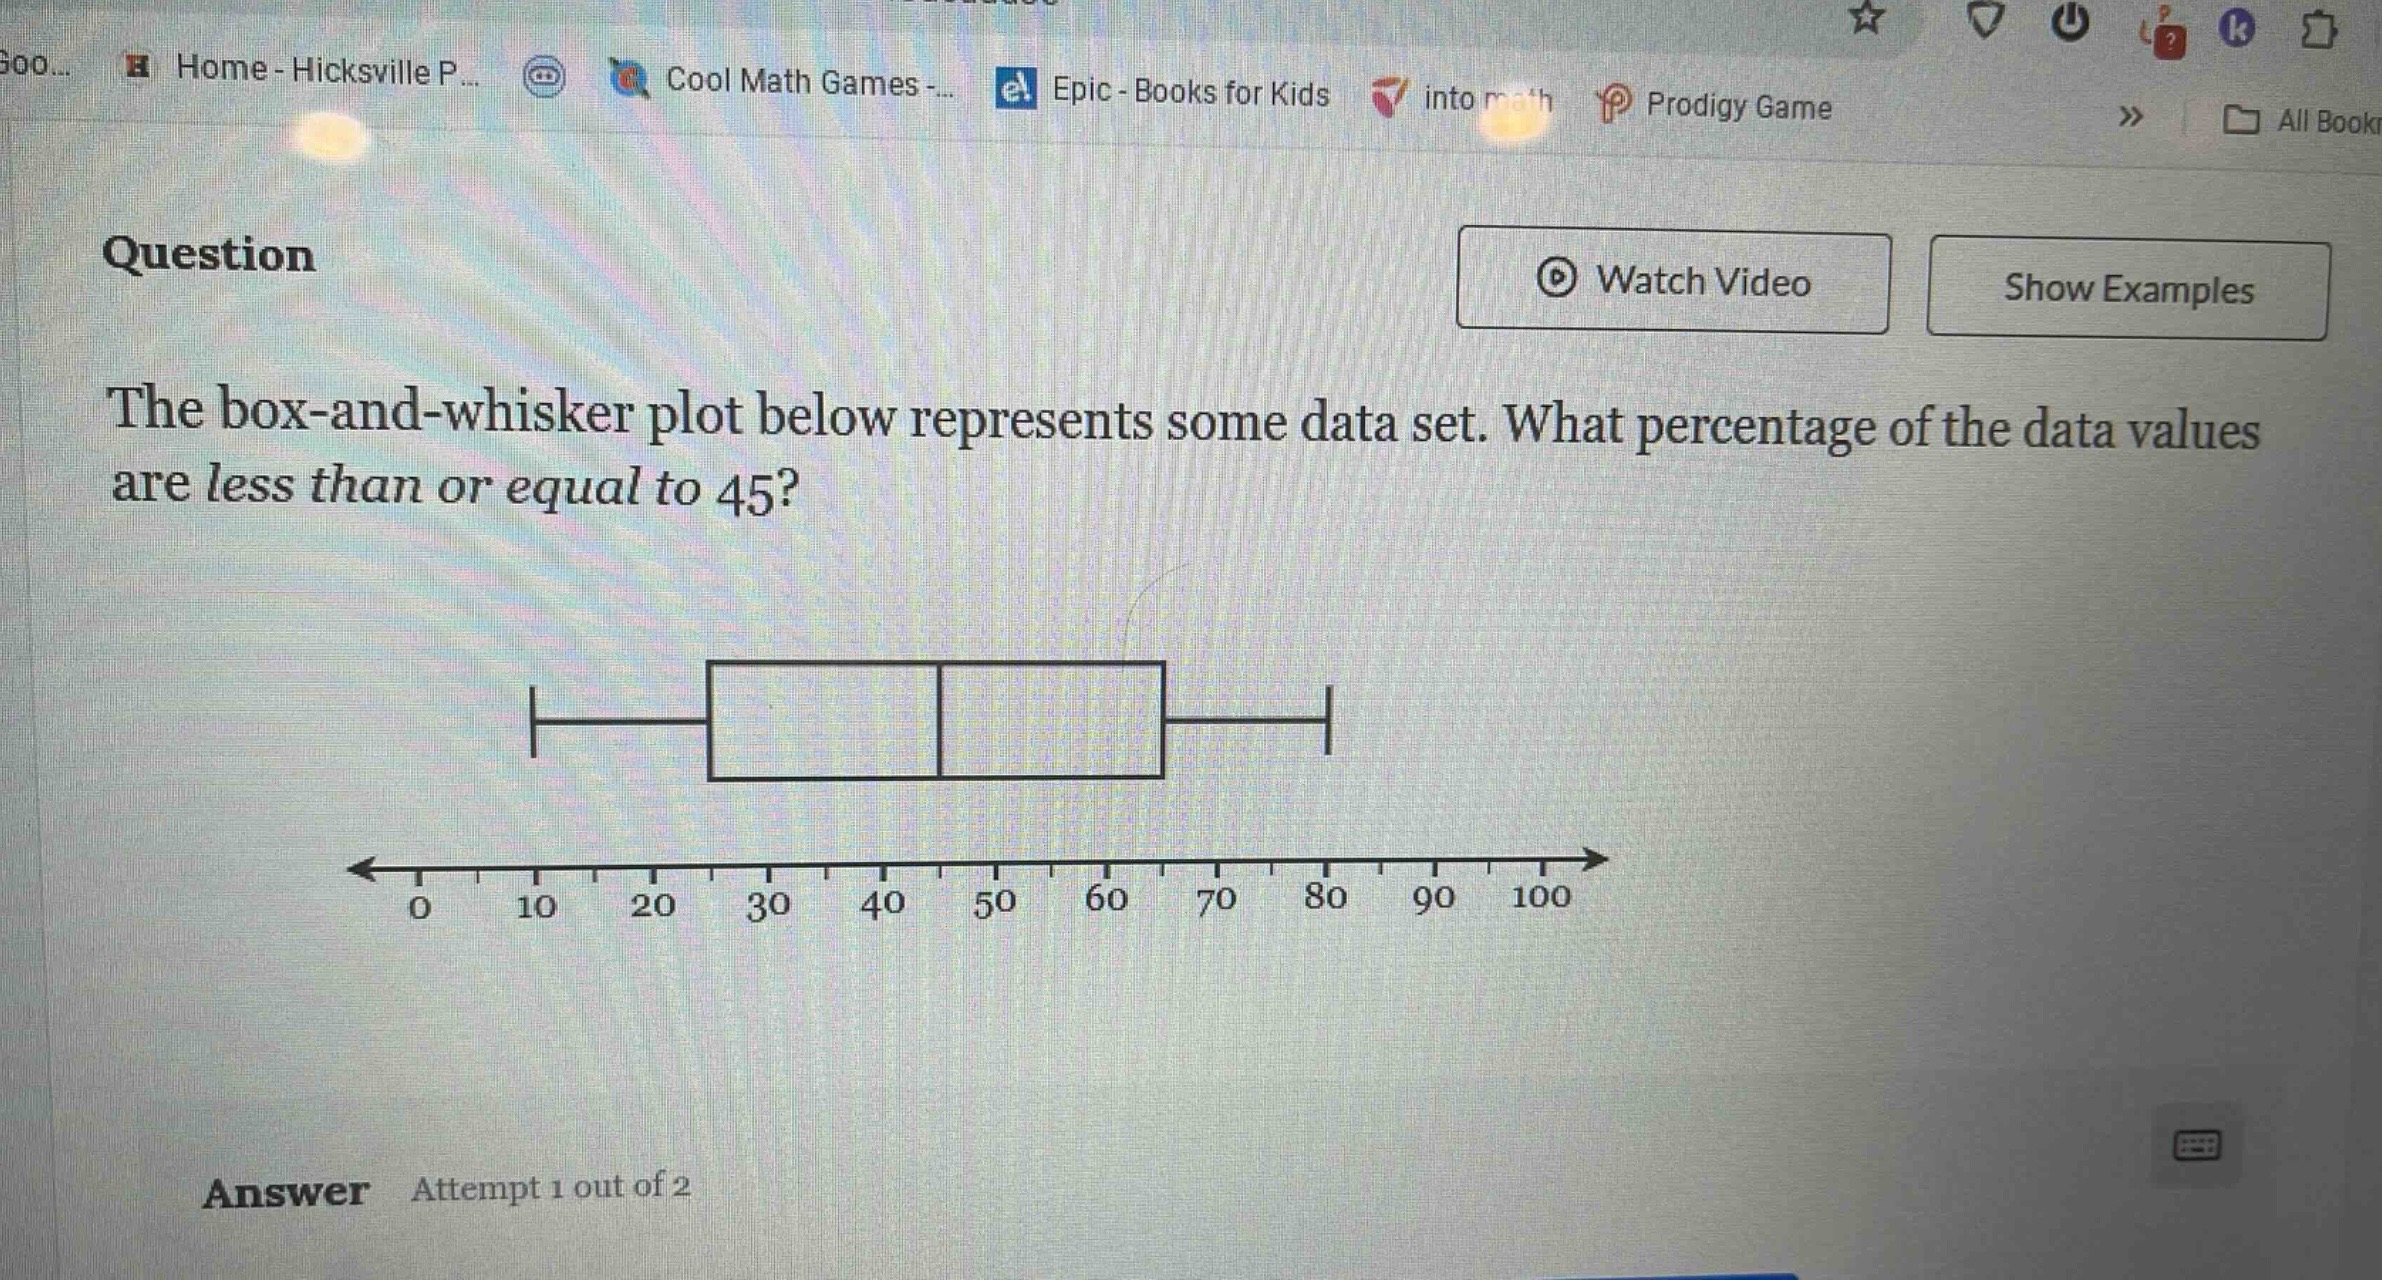
the box - and - whisker plot below represents some data set. what percentage of the data values are less than or equal to 45?
Answer
Explanation:
Step1: Recall the properties of box - and - whisker plots
In a box - and - whisker plot, the median (second quartile (Q_2)) divides the data set into two halves. The first quartile ((Q_1)) is the value below which 25% of the data lies, and the second quartile ((Q_2)) is the value below which 50% of the data lies, and the third quartile ((Q_3)) is the value below which 75% of the data lies.
Step2: Identify the position of 45
In a box - and - whisker plot, the median (the line inside the box) represents the 50th percentile. If we assume that 45 is the median (since in a standard box - and - whisker plot interpretation, and without loss of generality for the sake of answering based on quartile properties).
Answer:
50%