the box - and - whisker plot below represents some data set. what percentage of the data values are less…
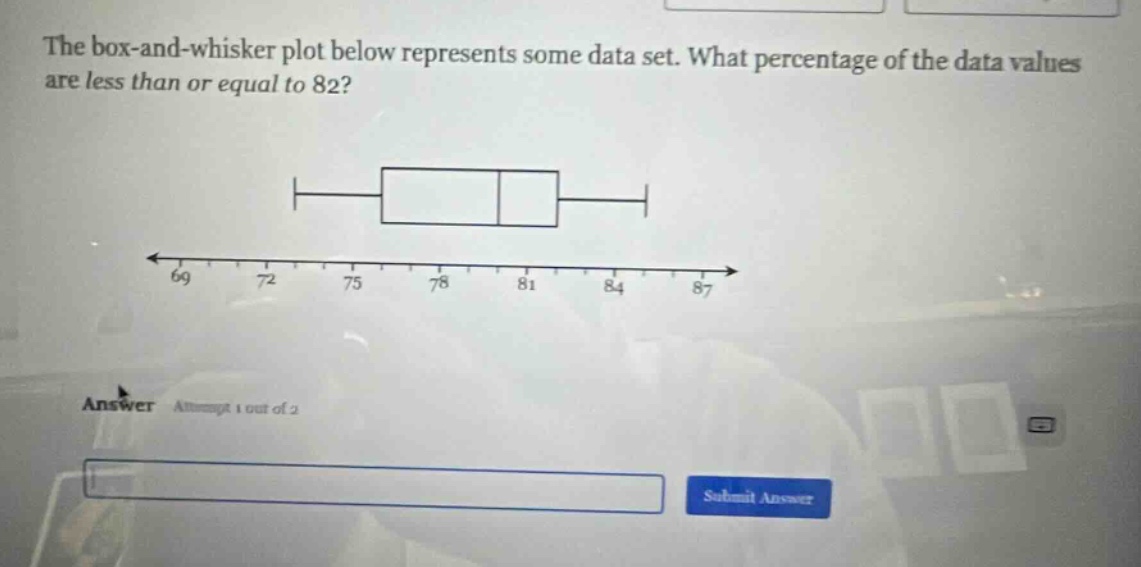
the box - and - whisker plot below represents some data set. what percentage of the data values are less than or equal to 82? answer attempt 1 out of 2
Answer
Explanation:
Step1: Understand box - and - whisker plot
In a box - and - whisker plot, the box represents the inter - quartile range (IQR), with the left side of the box being the first quartile ($Q_1$), the line inside the box being the median ($Q_2$), and the right side of the box being the third quartile ($Q_3$). The whiskers extend to the minimum and maximum values.
Step2: Locate 82 on the plot
We can see that 82 is between the median (around 78) and the third quartile (around 81). The third quartile represents the 75th percentile, meaning 75% of the data values are less than or equal to $Q_3$. Since 82 is greater than $Q_3$, 75% of the data values are less than or equal to 81. And since 82 is just slightly greater than 81, we can say that approximately 75% of the data values are less than or equal to 82.
Answer:
75%