the box - and - whisker plot below represents some data set. what is the value of the third quartile? answer…
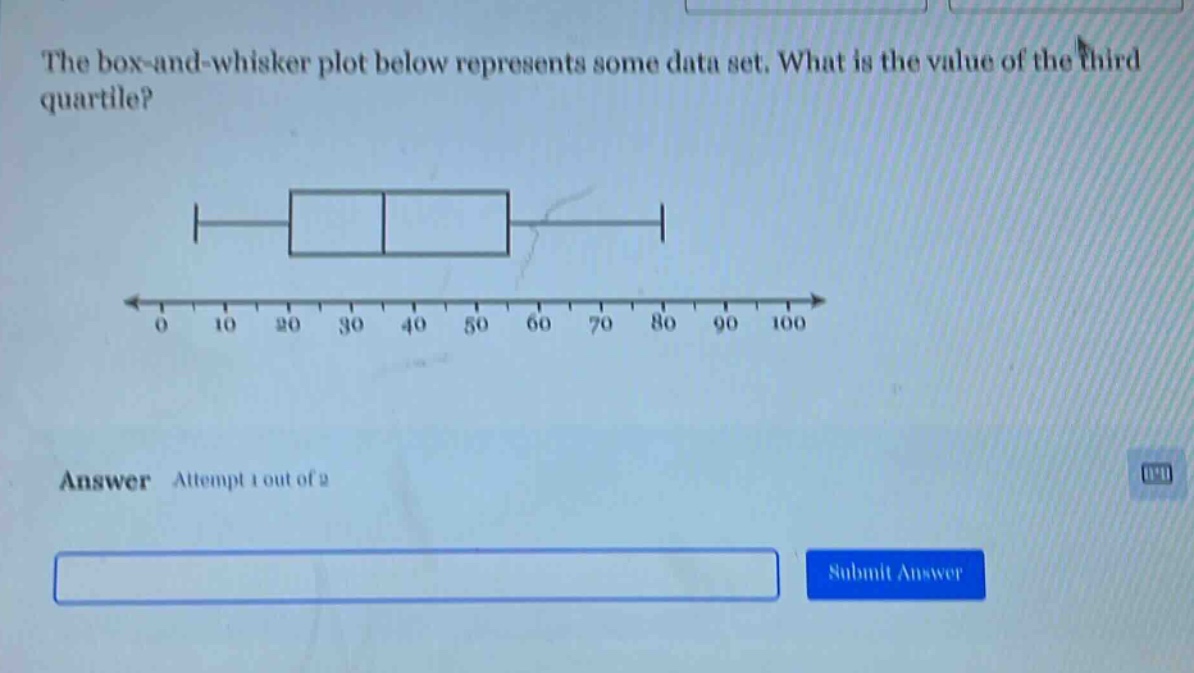
the box - and - whisker plot below represents some data set. what is the value of the third quartile? answer attempt 1 out of 2
Answer
Answer:
60
Explanation:
Step1: Recall box - and - whisker plot parts
In a box - and - whisker plot, the right - hand edge of the box represents the third quartile ($Q_3$).
Step2: Identify the value
Looking at the given box - and - whisker plot, the right - hand edge of the box is at 60. So $Q_3 = 60$.