the box-and-whisker plot below represents some data set. what is the value of the upper quartile?
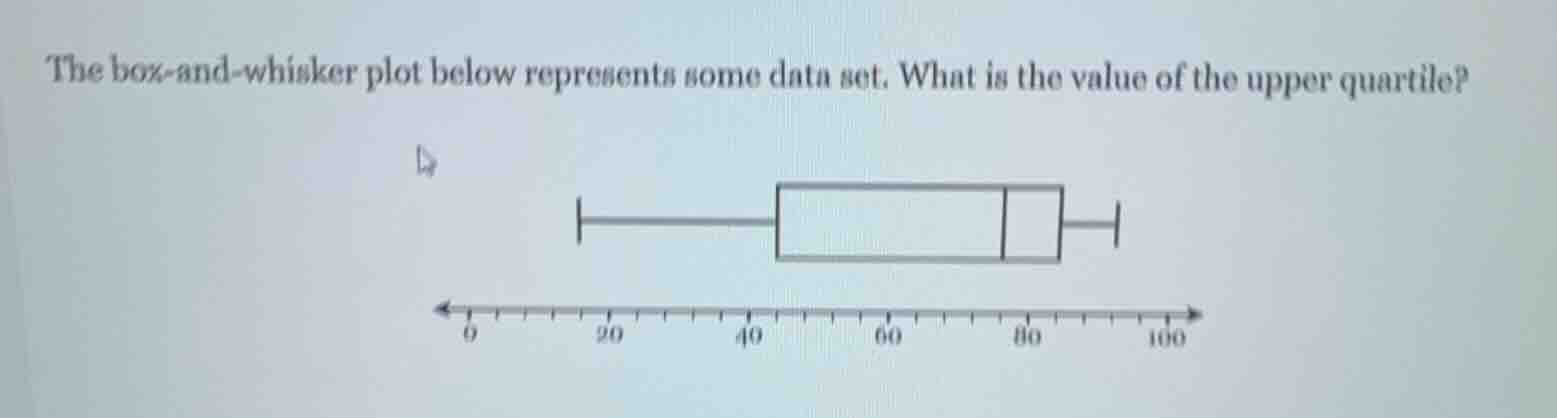
the box-and-whisker plot below represents some data set. what is the value of the upper quartile?
Answer
Explanation:
Step1: Recall box - and - whisker plot components
In a box - and - whisker plot, the box has three important lines: the lower quartile (Q1), the median (Q2), and the upper quartile (Q3). The upper quartile is the right - most line of the box (excluding the whisker on the upper end).
Step2: Analyze the given box - and - whisker plot
Looking at the number line below the box - and - whisker plot, we can see that the right - most line of the box is at the value of 80.
Answer:
The value of the upper quartile is 80.