a box - and - whisker plot shows:\n0 10 20 30 40 50 60 70 80 90 100\nteacher salaries in thousands (for…
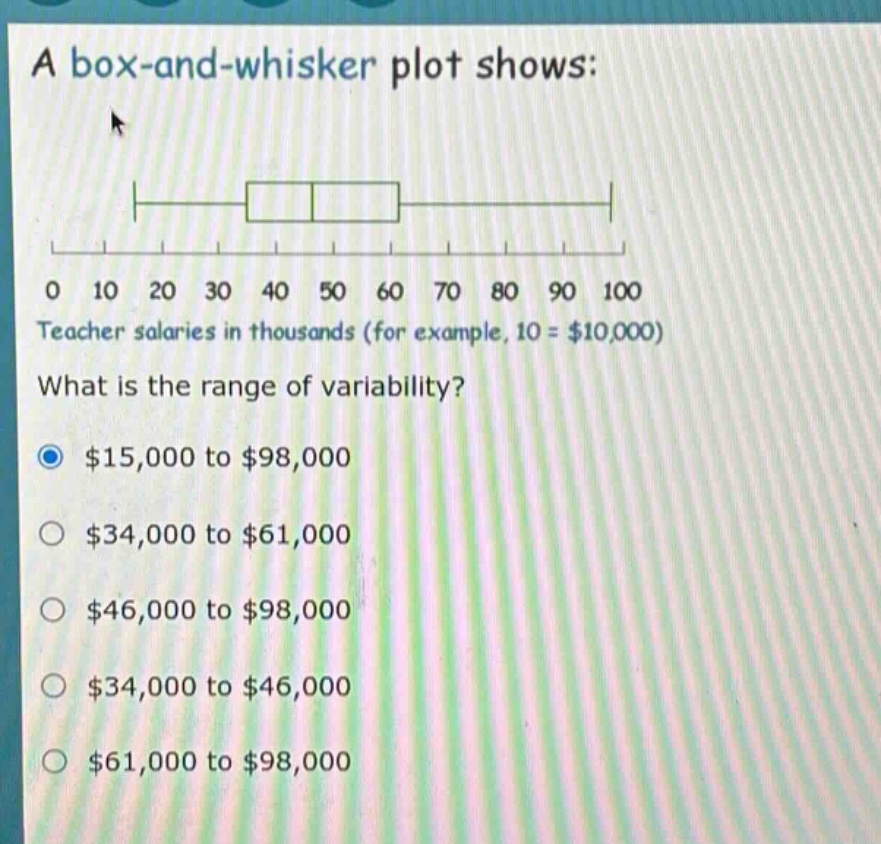
a box - and - whisker plot shows:\n0 10 20 30 40 50 60 70 80 90 100\nteacher salaries in thousands (for example, 10 = $10,000)\nwhat is the range of variability?\n$15,000 to $98,000\n$34,000 to $61,000\n$46,000 to $98,000\n$34,000 to $46,000\n$61,000 to $98,000
Answer
Explanation:
Step1: Recall range definition
The range of variability in a box - and - whisker plot is from the minimum value to the maximum value.
Step2: Identify minimum and maximum
From the box - and - whisker plot, the minimum value is 15 (in thousands) and the maximum value is 98 (in thousands). So the range is from $15,000$ to $98,000$.
Answer:
A. $15,000$ to $98,000$