the box - and - whisker plot below shows the same data.\nwhich of the following best explains why one graph…
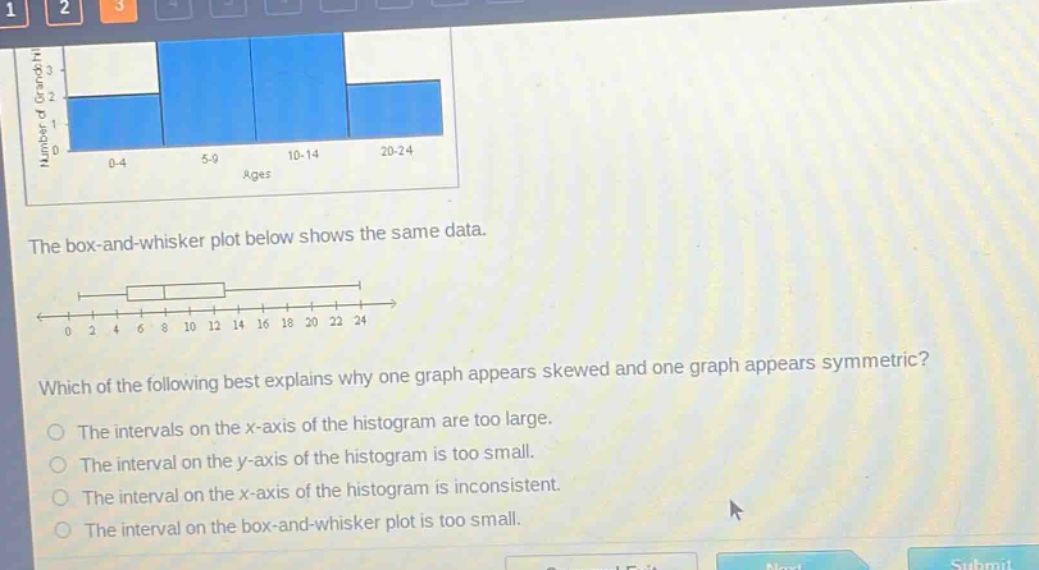
the box - and - whisker plot below shows the same data.\nwhich of the following best explains why one graph appears skewed and one graph appears symmetric?\nthe intervals on the x - axis of the histogram are too large.\nthe interval on the y - axis of the histogram is too small.\nthe interval on the x - axis of the histogram is inconsistent.\nthe interval on the box - and - whisker plot is too small.
Answer
Brief Explanations:
In a histogram, inconsistent x - axis intervals can distort the visual appearance of data distribution, making it seem skewed when it might not be in reality. A box - and - whisker plot shows the quartiles and range in a way that can better represent the true symmetry or skewness of the data. The other options about y - axis intervals of histogram or box - and - whisker plot intervals are not relevant to the difference in skewness/symmetry appearance.
Answer:
The interval on the x - axis of the histogram is inconsistent.