which box and whisker plot shows more \spread out\ data? top plot bottom plot
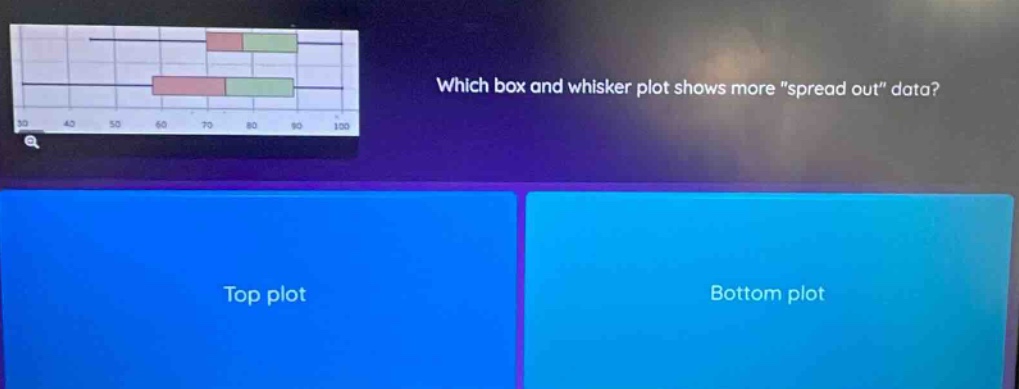
which box and whisker plot shows more \spread out\ data? top plot bottom plot
Answer
Explanation:
Step1: Understand spread in box - whisker plot
The spread of data in a box - whisker plot can be measured by the inter - quartile range (IQR) or the range. A larger range or IQR means more spread out data. The range is the difference between the maximum and minimum values.
Step2: Observe the plots
By visually inspecting the two box - whisker plots, we can see that the top plot has a larger distance between its minimum and maximum values (the ends of the whiskers).
Answer:
Top plot