the boxplot below displays the arm spans for 44 students. the five - number summary for the data is 143…
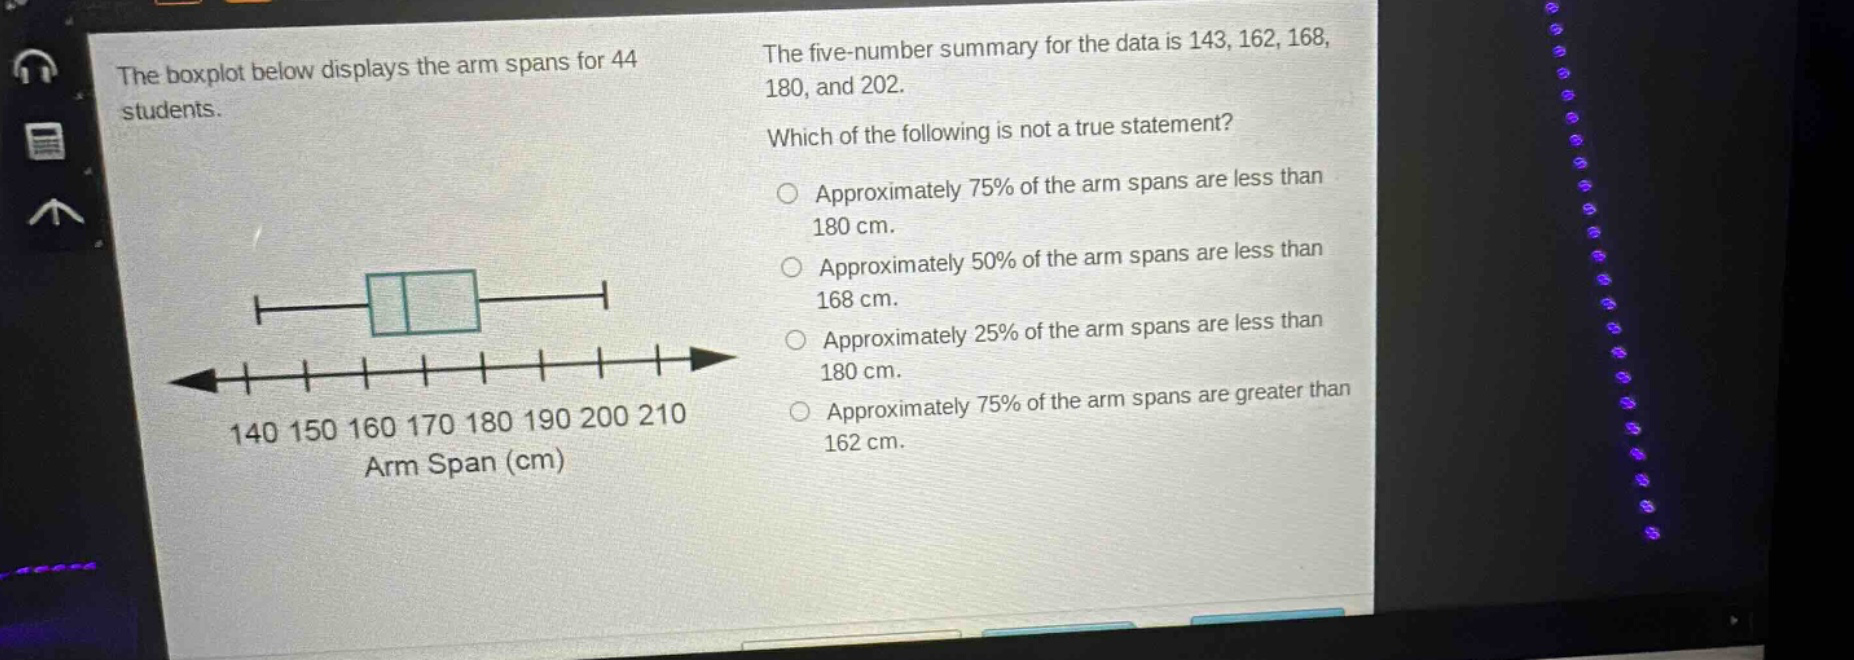
the boxplot below displays the arm spans for 44 students. the five - number summary for the data is 143, 162, 168, 180, and 202. which of the following is not a true statement? approximately 75% of the arm spans are less than 180 cm. approximately 50% of the arm spans are less than 168 cm. approximately 25% of the arm spans are less than 180 cm. approximately 75% of the arm spans are greater than 162 cm.
Answer
Answer:
Approximately 25% of the arm spans are less than 180 cm.
Explanation:
Step1: Recall five - number summary properties
In a five - number summary (minimum, Q1, median, Q3, maximum), Q1 represents the 25th percentile, median represents the 50th percentile, and Q3 represents the 75th percentile. Here, the five - number summary is 143 (minimum), 162 (Q1), 168 (median), 180 (Q3), 202 (maximum).
Step2: Analyze each statement
- Approximately 75% of the data is less than Q3. Since Q3 = 180, approximately 75% of the arm spans are less than 180 cm. This statement is true.
- Approximately 50% of the data is less than the median. Since the median is 168, approximately 50% of the arm spans are less than 168 cm. This statement is true.
- Approximately 25% of the data is less than Q1. Since Q1 = 162, approximately 25% of the arm spans are less than 162 cm, not 180 cm. This statement is false.
- Approximately 75% of the data is greater than Q1. Since Q1 = 162, approximately 75% of the arm spans are greater than 162 cm. This statement is true.