the boxplot displays the grades (out of 30) that 26 students received on a quiz. which of the following…
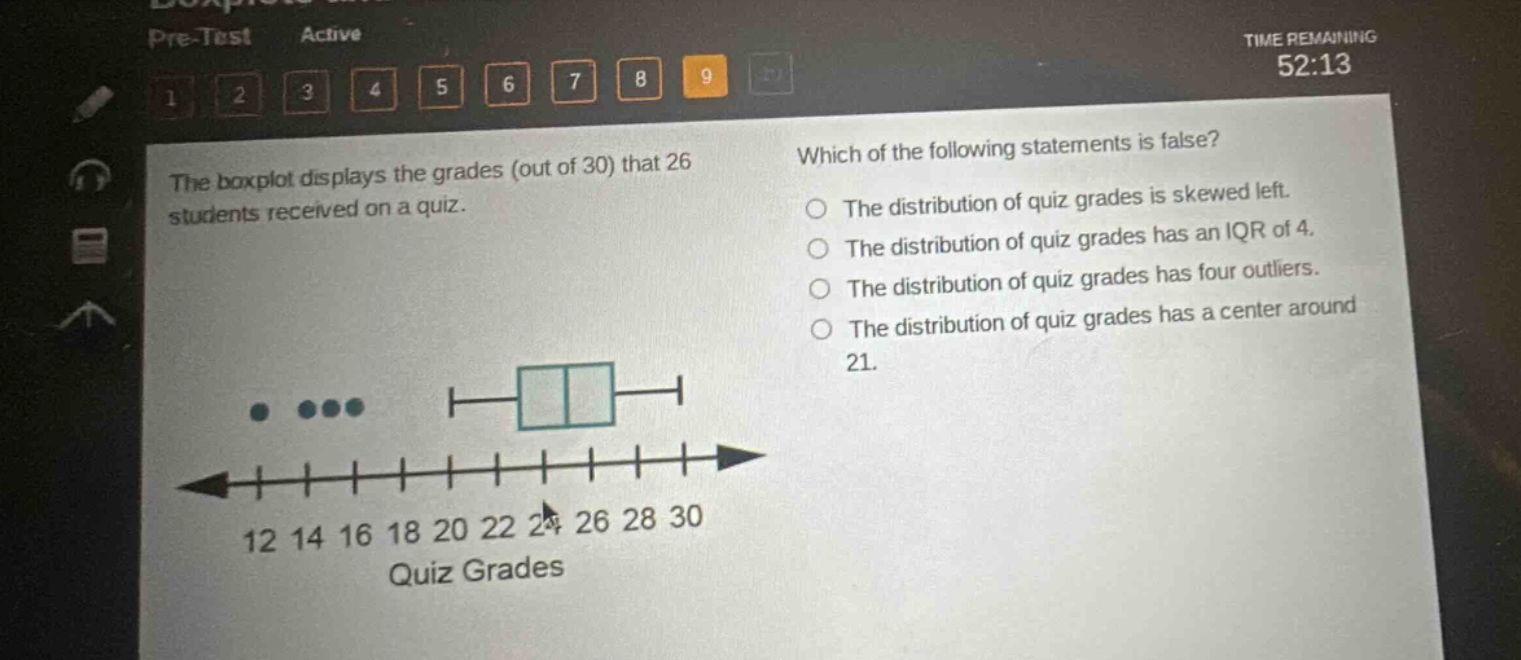
the boxplot displays the grades (out of 30) that 26 students received on a quiz. which of the following statements is false? the distribution of quiz grades is skewed left. the distribution of quiz grades has an iqr of 4. the distribution of quiz grades has four outliers. the distribution of quiz grades has a center around 21. 12 14 16 18 20 22 24 26 28 30 quiz grades
Answer
Answer:
The distribution of quiz grades has an IQR of 4.
Explanation:
Step1: Identify skewness
The box - plot has longer left - whisker, so it's skewed left.
Step2: Count outliers
There are 4 points outside the whiskers, so 4 outliers.
Step3: Estimate center
The median (center) is around 21.
Step4: Calculate IQR
The first quartile ($Q_1$) is around 20 and the third quartile ($Q_3$) is around 24. The inter - quartile range $IQR = Q_3 - Q_1=24 - 20 = 4$. But looking at the box - plot, the box does not represent an IQR of 4 precisely as the box seems to span more than 4 units on the scale, so this statement is false.