brand a and brand b of frozen green beans both list a weight of 32 ounces on their bags. because of…
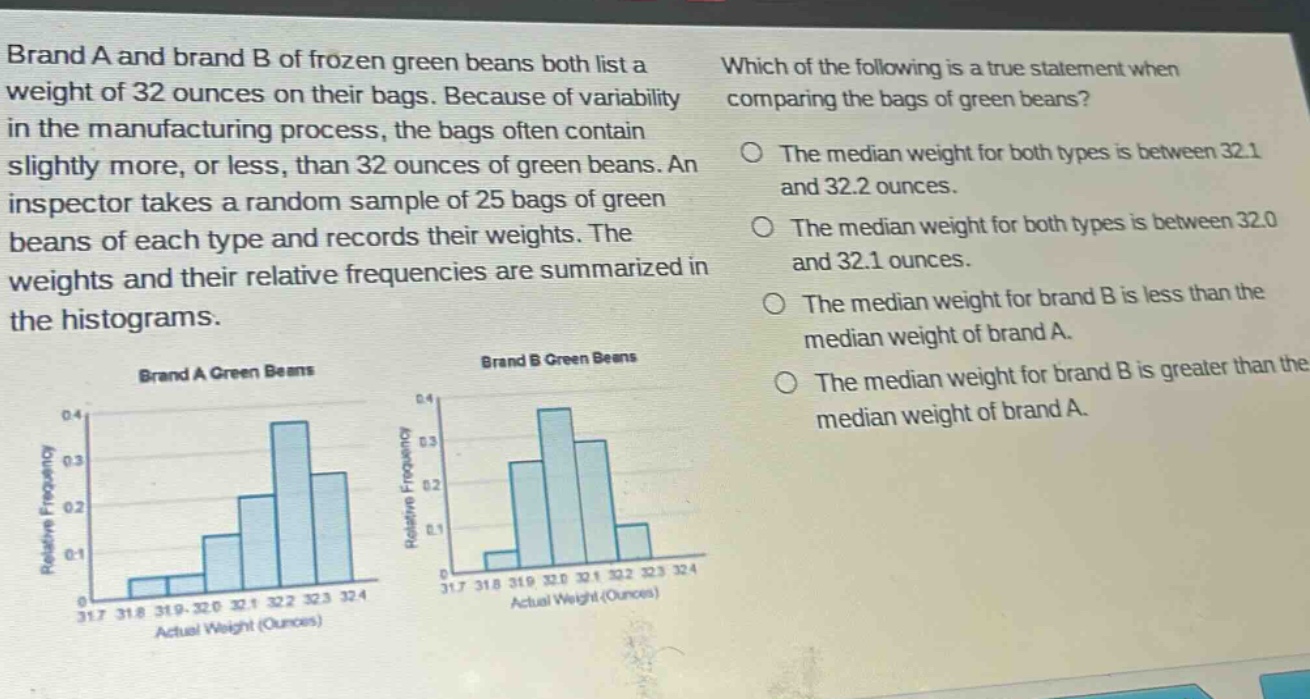
brand a and brand b of frozen green beans both list a weight of 32 ounces on their bags. because of variability in the manufacturing process, the bags often contain slightly more, or less, than 32 ounces of green beans. an inspector takes a random sample of 25 bags of green beans of each type and records their weights. the weights and their relative frequencies are summarized in the histograms. which of the following is a true statement when comparing the bags of green beans? the median weight for both types is between 32.1 and 32.2 ounces. the median weight for both types is between 32.0 and 32.1 ounces. the median weight for brand b is less than the median weight of brand a. the median weight for brand b is greater than the median weight of brand a.
Answer
Explanation:
Step1: Determine sample size
The sample size $n = 25$ for each brand. Since $n = 25$ (an odd - numbered sample), the median is the $\left(\frac{n + 1}{2}\right)$-th value, i.e., the 13 - th ordered value.
Step2: Analyze Brand A histogram
For Brand A, the relative frequencies start accumulating. The first two intervals have low relative frequencies. The interval $32.1 - 32.2$ has a relatively high relative frequency. By cumulative relative - frequency analysis, the 13 - th value lies in the $32.1 - 32.2$ interval.
Step3: Analyze Brand B histogram
For Brand B, the first few intervals have some relative frequencies, but the interval $32.0 - 32.1$ has a high relative frequency. By cumulative relative - frequency analysis, the 13 - th value lies in the $32.0 - 32.1$ interval. So the median weight for brand B is less than the median weight of brand A.
Answer:
The median weight for brand B is less than the median weight of brand A.