a brand of frozen green beans lists a weight of 32 ounces on its bag. because of variability in the…
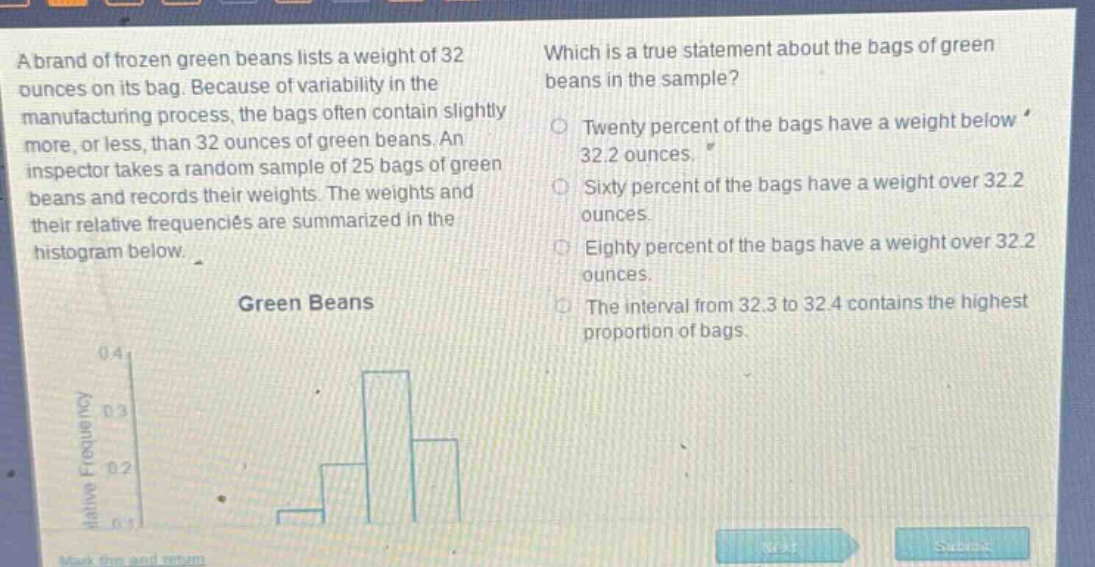
a brand of frozen green beans lists a weight of 32 ounces on its bag. because of variability in the manufacturing process, the bags often contain slightly more, or less, than 32 ounces of green beans. an inspector takes a random sample of 25 bags of green beans and records their weights. the weights and their relative frequencies are summarized in the histogram below. which is a true statement about the bags of green beans in the sample? twenty percent of the bags have a weight below 32.2 ounces. sixty percent of the bags have a weight over 32.2 ounces. eighty percent of the bags have a weight over 32.2 ounces. the interval from 32.3 to 32.4 contains the highest proportion of bags.
Answer
Explanation:
Step1: Analyze relative - frequency concept
Relative frequency represents the proportion of data in a particular interval.
Step2: Check each option
If we assume the intervals are set up such that the cumulative relative - frequency up to a certain point gives the proportion of data below that value. If the cumulative relative - frequency up to 32.2 ounces is 0.2, then 20% of the bags have a weight below 32.2 ounces. If 20% of the bags have a weight below 32.2 ounces, then 80% of the bags have a weight over 32.2 ounces.
Answer:
C. Eighty percent of the bags have a weight over 32.2 ounces.