brett is performing a hypothesis test in which the population mean is 310 and the standard deviation is 20…
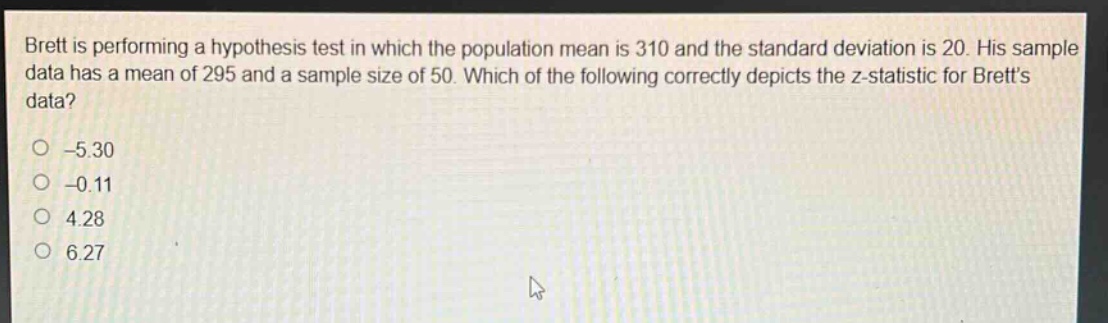
brett is performing a hypothesis test in which the population mean is 310 and the standard deviation is 20. his sample data has a mean of 295 and a sample size of 50. which of the following correctly depicts the z - statistic for bretts data? -5.30 -0.11 4.28 6.27
Answer
Explanation:
Step1: Recall z - statistic formula
The formula for the z - statistic of a sample mean is $z=\frac{\bar{x}-\mu}{\frac{\sigma}{\sqrt{n}}}$, where $\bar{x}$ is the sample mean, $\mu$ is the population mean, $\sigma$ is the population standard deviation, and $n$ is the sample size.
Step2: Identify given values
We are given that $\mu = 310$, $\sigma=20$, $\bar{x}=295$, and $n = 50$.
Step3: Substitute values into formula
$z=\frac{295 - 310}{\frac{20}{\sqrt{50}}}$. First, calculate the denominator: $\sqrt{50}\approx7.071$, and $\frac{20}{\sqrt{50}}=\frac{20}{7.071}\approx2.83$. Then, calculate the numerator: $295 - 310=-15$. So, $z=\frac{-15}{2.83}\approx - 5.30$.
Answer:
-5.30