bruce helps answer mail for the mayor of pineville. after the mayor visited his towns middle school last…
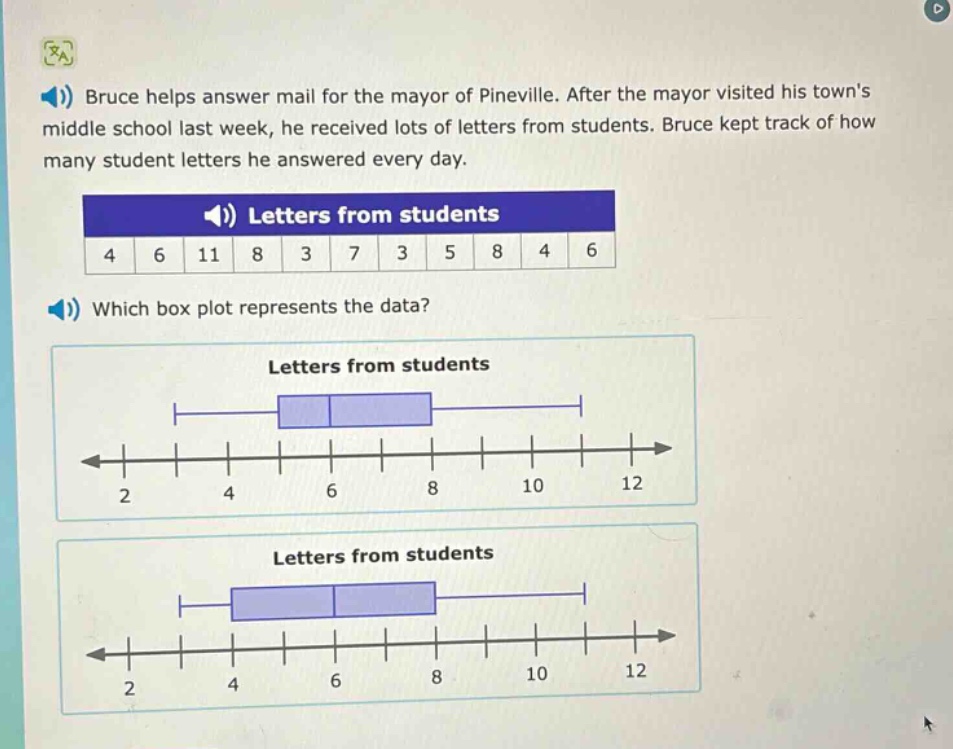
bruce helps answer mail for the mayor of pineville. after the mayor visited his towns middle school last week, he received lots of letters from students. bruce kept track of how many student letters he answered every day.\nletters from students\n4 6 11 8 3 7 3 5 8 4 6\nwhich box plot represents the data?\nletters from students\nletters from students
Answer
Explanation:
Step1: Arrange data in ascending order
3, 3, 4, 4, 5, 6, 6, 7, 8, 8, 11
Step2: Find the median (Q2)
There are 11 data - points. The median is the 6th value. So, Q2 = 6.
Step3: Find the lower half of data
3, 3, 4, 4, 5. The median of the lower half (Q1) is 4.
Step4: Find the upper half of data
6, 7, 8, 8, 11. The median of the upper half (Q3) is 8.
Step5: Identify the minimum and maximum
The minimum value is 3 and the maximum value is 11.
Step6: Analyze box - plots
The box - plot should have the minimum at 3, Q1 at 4, Q2 at 6, Q3 at 8, and the maximum at 11.
Answer:
The box - plot with the minimum at 3, the left - hand side of the box at 4, the line inside the box at 6, the right - hand side of the box at 8, and the maximum at 11. (Without seeing the exact visual differences between the two provided box - plots in a more detailed way, based on the calculated values, the correct box - plot should match these quartile and extreme values).