bryson collects data on the depth of a river at various points and the velocity of the river at those…
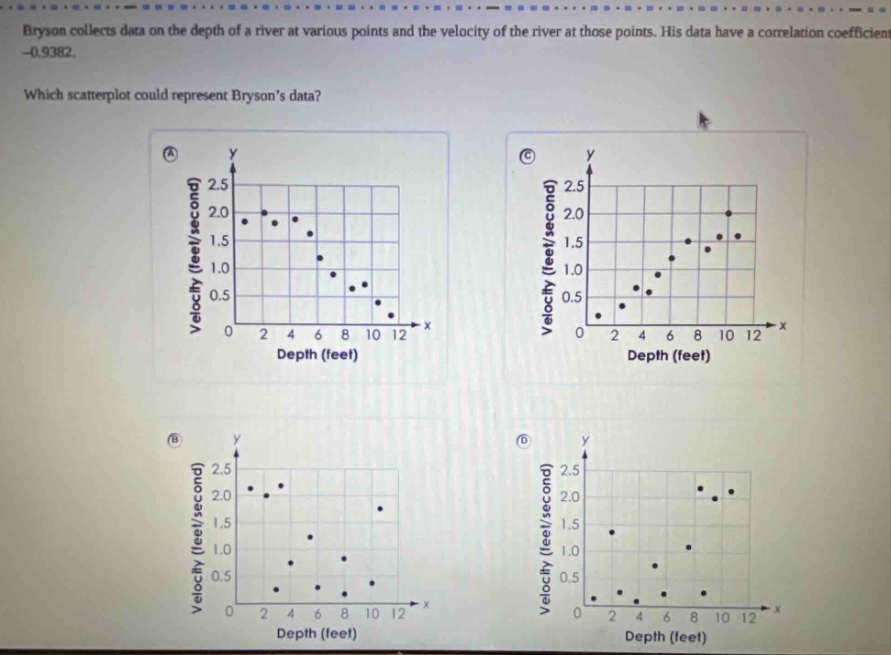
bryson collects data on the depth of a river at various points and the velocity of the river at those points. his data have a correlation coefficient of -0.9382. which scatter - plot could represent brysons data?
Answer
Explanation:
Step1: Understand correlation coefficient
A correlation coefficient of - 0.9382 indicates a strong negative linear - relationship. That is, as the depth of the river (x - variable) increases, the velocity of the river (y - variable) decreases.
Step2: Analyze scatter - plots
In a scatter - plot representing a strong negative linear relationship, the points should generally form a pattern sloping downwards from left to right.
- Option A: The points in option A show a downward - sloping pattern, indicating that as the depth (x) increases, the velocity (y) decreases, which is consistent with a negative correlation.
- Option B: The points in option B are randomly scattered, indicating no linear relationship.
- Option C: The points in option C show an upward - sloping pattern, indicating a positive correlation (as x increases, y increases).
- Option D: The points in option D are randomly scattered, indicating no linear relationship.
Answer:
A.