the bulldogs and condors played ten games this season. which scatter plot represents the data?\nruns scored…
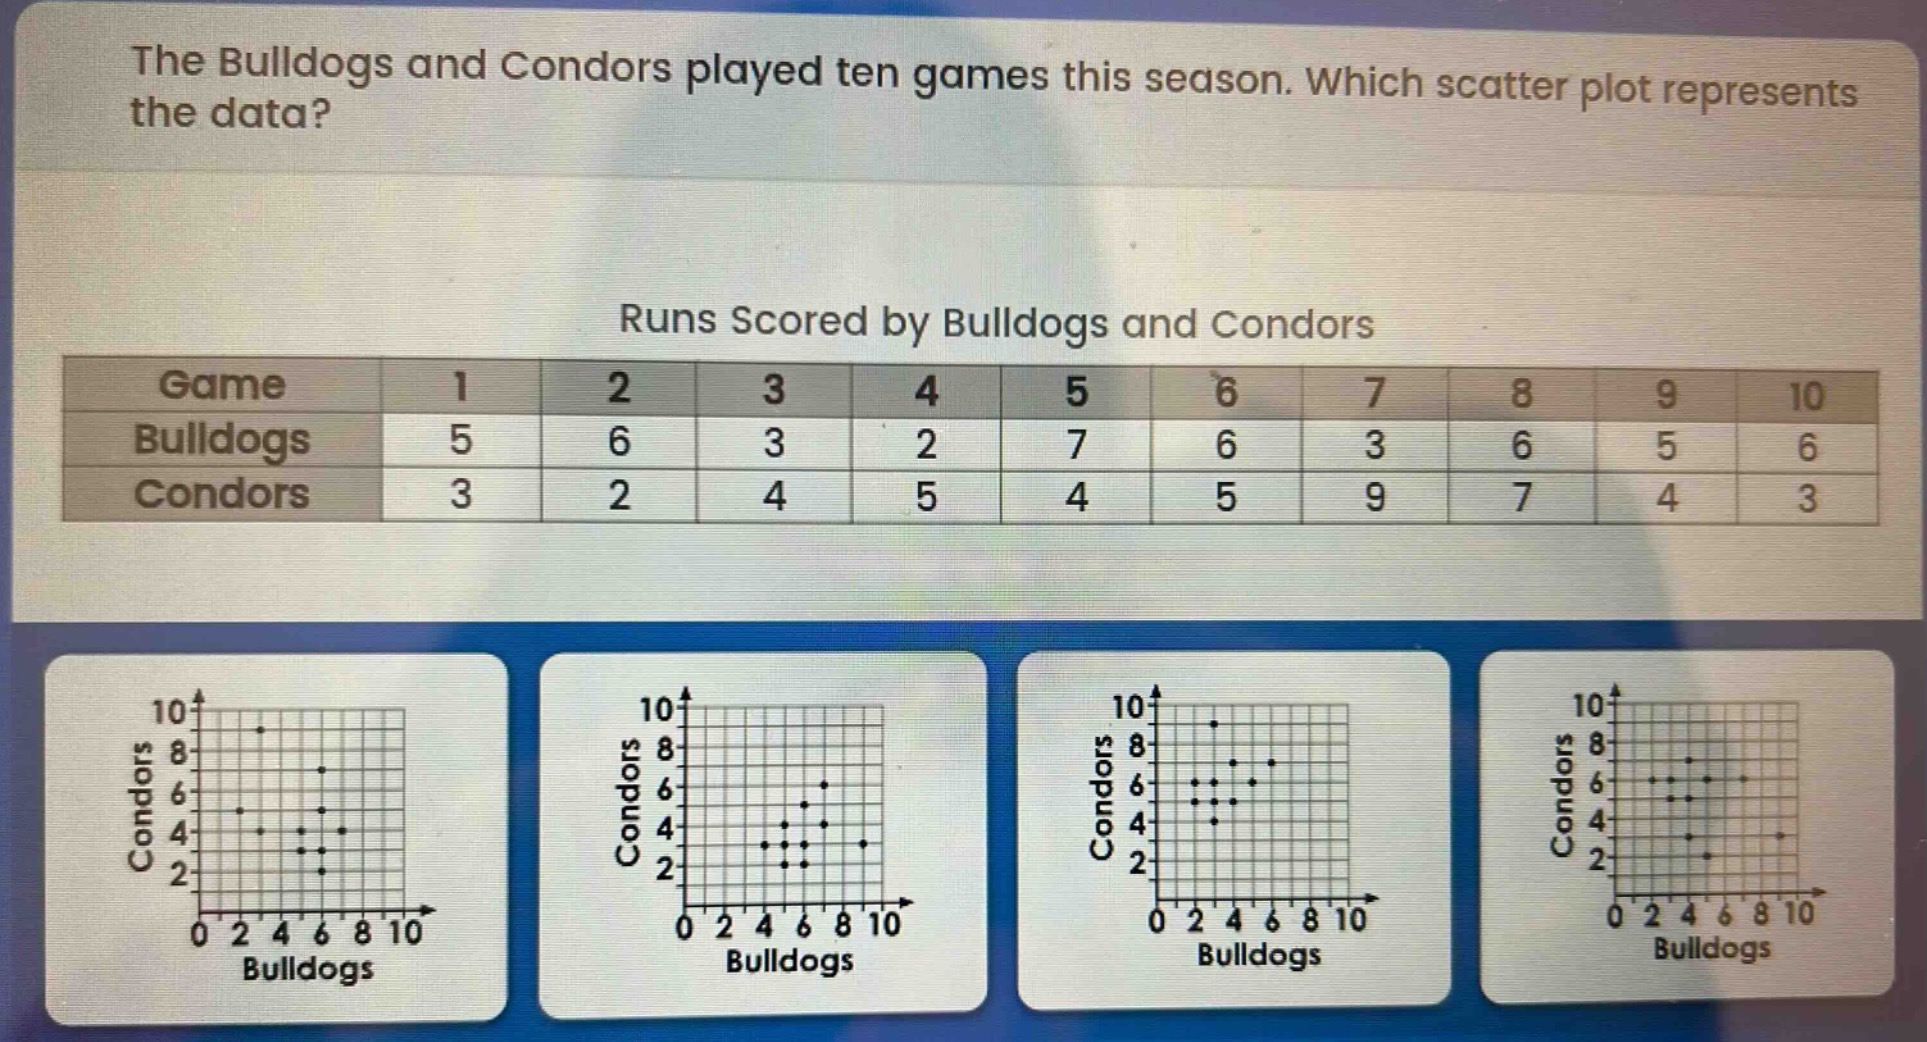
the bulldogs and condors played ten games this season. which scatter plot represents the data?\nruns scored by bulldogs and condors\n|game|1|2|3|4|5|6|7|8|9|10|\n|--|--|--|--|--|--|--|--|--|--|--|\n|bulldogs|5|6|3|2|7|6|3|6|5|6|\n|condors|3|2|4|5|4|5|9|7|4|3|
Answer
Explanation:
Step1: Identify data points
For each game, we have a pair of values - runs scored by Bulldogs and runs scored by Condors. For example, in game 1, Bulldogs scored 5 runs and Condors scored 3 runs, giving the data - point (5, 3).
Step2: Check scatter - plots
We go through each scatter - plot and check if the data points match the pairs from the table. For the first scatter - plot:
- When Bulldogs = 5, Condors = 3 (matches game 1).
- When Bulldogs = 6, Condors = 2 (matches game 2).
- When Bulldogs = 3, Condors = 4 (matches game 3).
- When Bulldogs = 2, Condors = 5 (matches game 4).
- When Bulldogs = 7, Condors = 4 (matches game 5).
- When Bulldogs = 6, Condors = 5 (matches game 6).
- When Bulldogs = 3, Condors = 9 (matches game 7).
- When Bulldogs = 6, Condors = 7 (matches game 8).
- When Bulldogs = 5, Condors = 4 (matches game 9).
- When Bulldogs = 6, Condors = 3 (matches game 10).
Answer:
The first scatter - plot.