camerons scout leader organized a contest to see who could build the strongest boat out of aluminum foil…
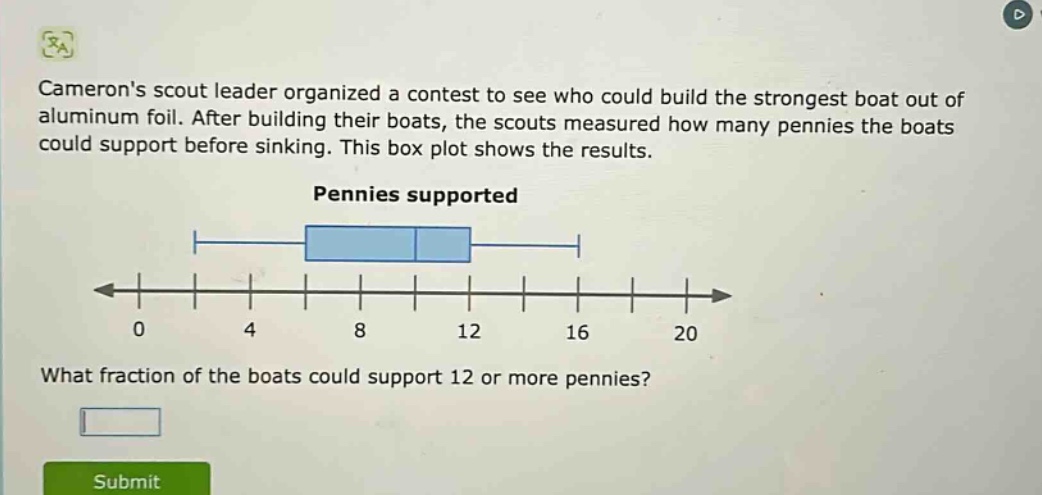
camerons scout leader organized a contest to see who could build the strongest boat out of aluminum foil. after building their boats, the scouts measured how many pennies the boats could support before sinking. this box plot shows the results. pennies supported what fraction of the boats could support 12 or more pennies?
Answer
Explanation:
Step1: Understand box - plot quartiles
In a box - plot, the box is divided into quartiles. The right - hand side of the box represents the third quartile ($Q_3$), and the values from $Q_3$ to the maximum value are the upper 25% of the data.
Step2: Identify relevant part of data
The value 12 is at the third - quartile ($Q_3$) of the box - plot. The values 12 or more are the upper 25% of the data.
Step3: Convert to fraction
25% can be written as the fraction $\frac{1}{4}$.
Answer:
$\frac{1}{4}$