a car dealership owner created a data table to see how many new and used cars were sold over several…
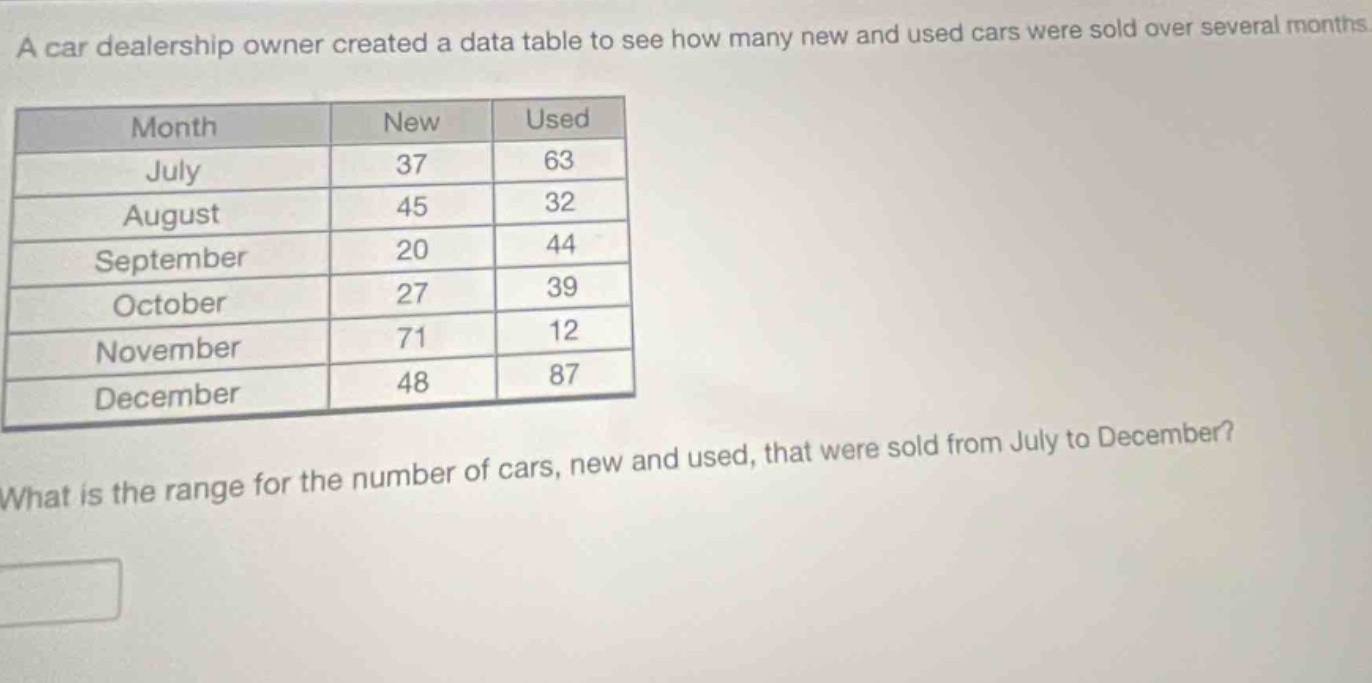
a car dealership owner created a data table to see how many new and used cars were sold over several months.\n| month | new | used |\n| ---- | ---- | ---- |\n| july | 37 | 63 |\n| august | 45 | 32 |\n| september | 20 | 44 |\n| october | 27 | 39 |\n| november | 71 | 12 |\n| december | 48 | 87 |\nwhat is the range for the number of cars, new and used, that were sold from july to december?
Answer
Answer:
75
Explanation:
Step1: Calculate total cars per - month
July: $37 + 63=100$; August: $45 + 32 = 77$; September: $20+44 = 64$; October: $27 + 39=66$; November: $71+12 = 83$; December: $48 + 87=135$.
Step2: Find maximum value
The maximum value among the totals is 135 (December).
Step3: Find minimum value
The minimum value among the totals is 64 (September).
Step4: Calculate the range
Range = Maximum - Minimum = $135 - 64=75$.