carlos is heading a student council project to improve cafeteria meals. he surveyed all students who eat…
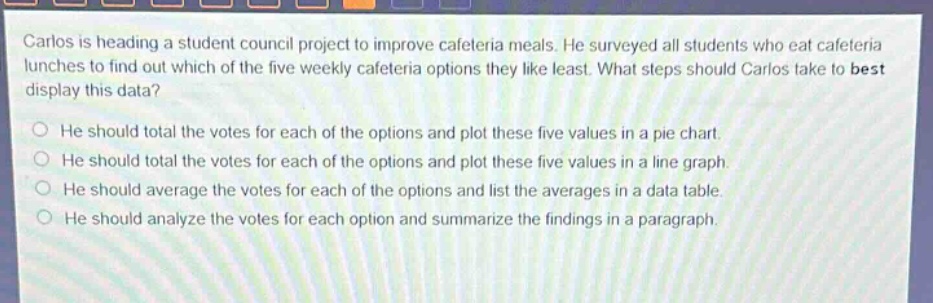
carlos is heading a student council project to improve cafeteria meals. he surveyed all students who eat cafeteria lunches to find out which of the five weekly cafeteria options they like least. what steps should carlos take to best display this data? he should total the votes for each of the options and plot these five values in a pie chart. he should total the votes for each of the options and plot these five values in a line graph. he should average the votes for each of the options and list the averages in a data table. he should analyze the votes for each option and summarize the findings in a paragraph.
Answer
Brief Explanations:
A pie - chart is ideal for showing parts of a whole. Here, the total votes for each option represent parts of the total number of votes cast. A line graph is better for showing trends over time, averaging votes and listing in a data table doesn't display the relative popularity well, and summarizing in a paragraph is not as visual as a chart.
Answer:
He should total the votes for each of the options and plot these five values in a pie chart.