what is the center of the data in the dot plot?\nnumber of science homework assignments each week\n0 1 2 3 4…
what is the center of the data in the dot plot?\nnumber of science homework assignments each week\n0 1 2 3 4 5\n2\n2.5\n3\n5
Answer
Explanation:
Step1: Count data - points
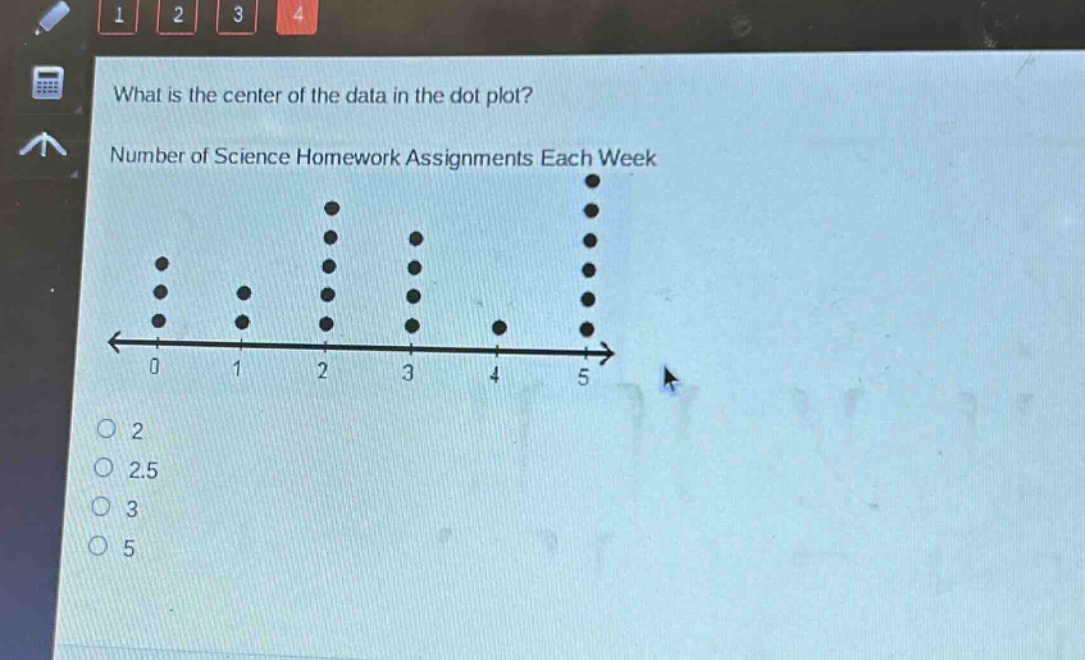
There are 3 points at 0, 1 point at 1, 5 points at 2, 4 points at 3, 1 point at 4, and 6 points at 5. The total number of data - points is (3 + 1+5 + 4+1 + 6=20).
Step2: Find the median position
Since (n = 20) (an even - numbered data set), the median position is (\frac{n}{2}=10) and (\frac{n}{2}+1 = 11).
Step3: Order and find the middle values
Ordering the data by the number of assignments, we list out the values based on the frequency. The 10th and 11th values fall within the group of 2.
Answer:
2