charles wants to analyze his last 9 math test scores with a box plot to see how spread apart they are…
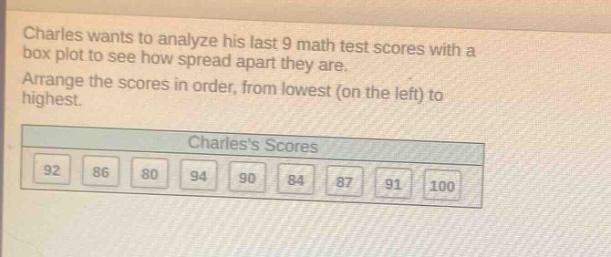
charles wants to analyze his last 9 math test scores with a box plot to see how spread apart they are. arrange the scores in order, from lowest (on the left) to highest.\ncharless scores\n92 86 80 94 90 84 87 91 100
Answer
Answer:
80, 84, 86, 87, 90, 91, 92, 94, 100
Explanation:
Step1: Compare first two scores
Compare 92 and 86, 86 is lower.
Step2: Compare with next score
Compare 86 and 80, 80 is lower.
Step3: Compare with next score
Compare 80 and 94, 80 is lower.
Step4: Compare with next score
Compare 80 and 90, 80 is lower.
Step5: Compare with next score
Compare 80 and 84, 80 is lower.
Step6: Compare with next score
Compare 80 and 87, 80 is lower.
Step7: Compare with next score
Compare 80 and 91, 80 is lower.
Step8: Compare with next score
Compare 80 and 100, 80 is lower. So 80 is the lowest. Then start over with the remaining scores and repeat the process to get the full - ordered list: 80, 84, 86, 87, 90, 91, 92, 94, 100.