charlie used a regression calculator to generate the equation $f(x)=-0.15x + 20.1$ for the ordered pairs…
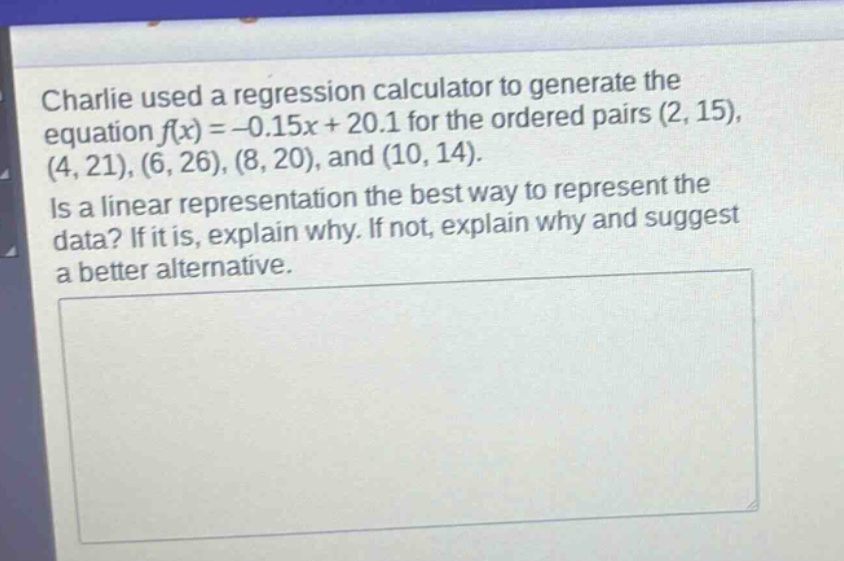
charlie used a regression calculator to generate the equation $f(x)=-0.15x + 20.1$ for the ordered pairs $(2,15),(4,21),(6,26),(8,20)$, and $(10,14)$. is a linear representation the best way to represent the data? if it is, explain why. if not, explain why and suggest a better alternative.
Answer
Brief Explanations:
To determine if a linear representation is best, we can plot the points and see if they roughly form a line. For the given points (2,15), (4,21), (6,26), (8,20), (10,14), when we plot them, we observe that they do not follow a straight - line pattern closely. A linear model assumes a constant rate of change. Here, the y - values do not change at a constant rate with respect to the x - values. A better alternative could be a quadratic model since the data seems to have a curve (it first increases and then decreases).
Answer:
No, a linear representation is not the best way to represent the data because the points do not follow a straight - line pattern closely. A quadratic model may be a better alternative.