the chart represents a data sets given values, predicted values (using a line of best fit for the data), and…
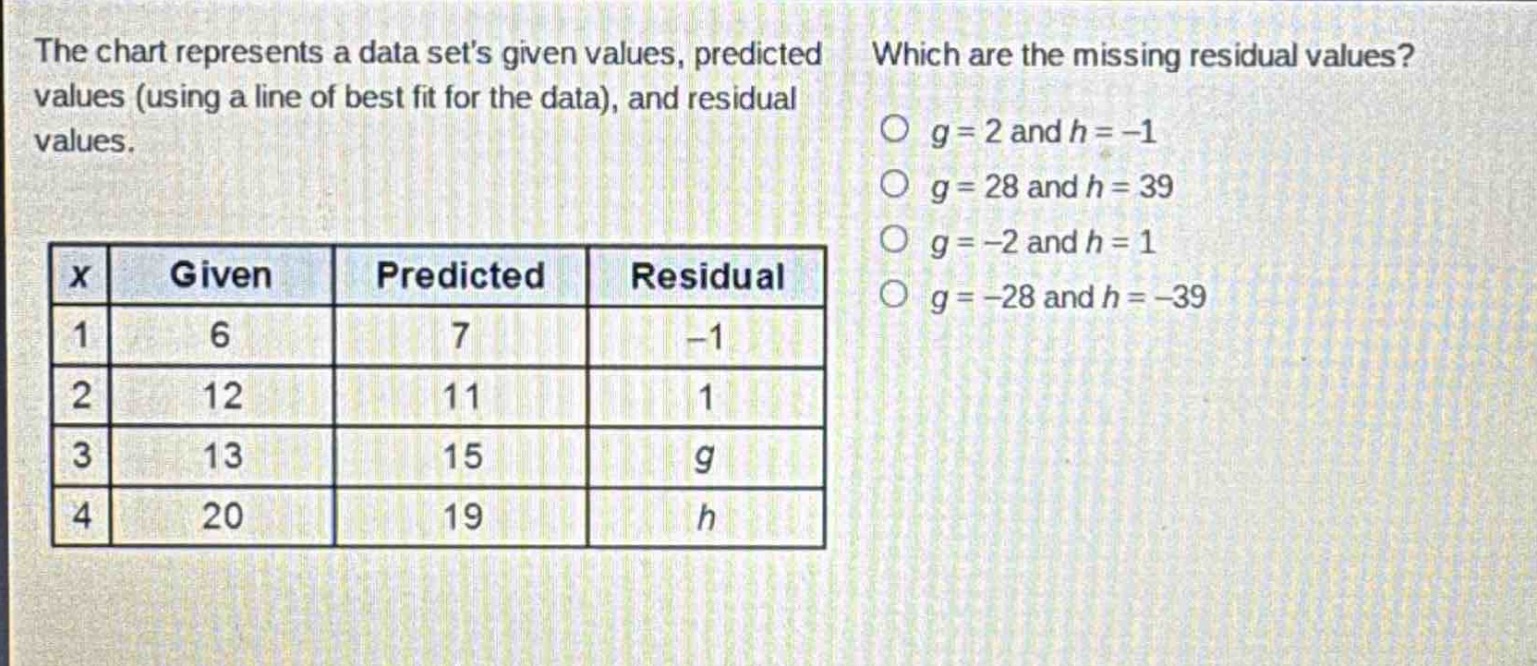
the chart represents a data sets given values, predicted values (using a line of best fit for the data), and residual values. which are the missing residual values? o g = 2 and h = -1 o g = 28 and h = 39 o g = -2 and h = 1 o g = -28 and h = -39\n|x|given|predicted|residual|\n|----|----|----|----|\n|1|6|7|-1|\n|2|12|11|1|\n|3|13|15|g|\n|4|20|19|h|
Answer
Explanation:
Step1: Recall residual formula
Residual = Given - Predicted
Step2: Calculate g
For $x = 3$, Given = 13, Predicted = 15. So $g=13 - 15=- 2$
Step3: Calculate h
For $x = 4$, Given = 20, Predicted = 19. So $h=20 - 19 = 1$
Answer:
C. $g=-2$ and $h = 1$