choose the most appropriate r - value for the scatter plot. (1 point) o r = -0.3 o r = 0.8 o r = 0.2
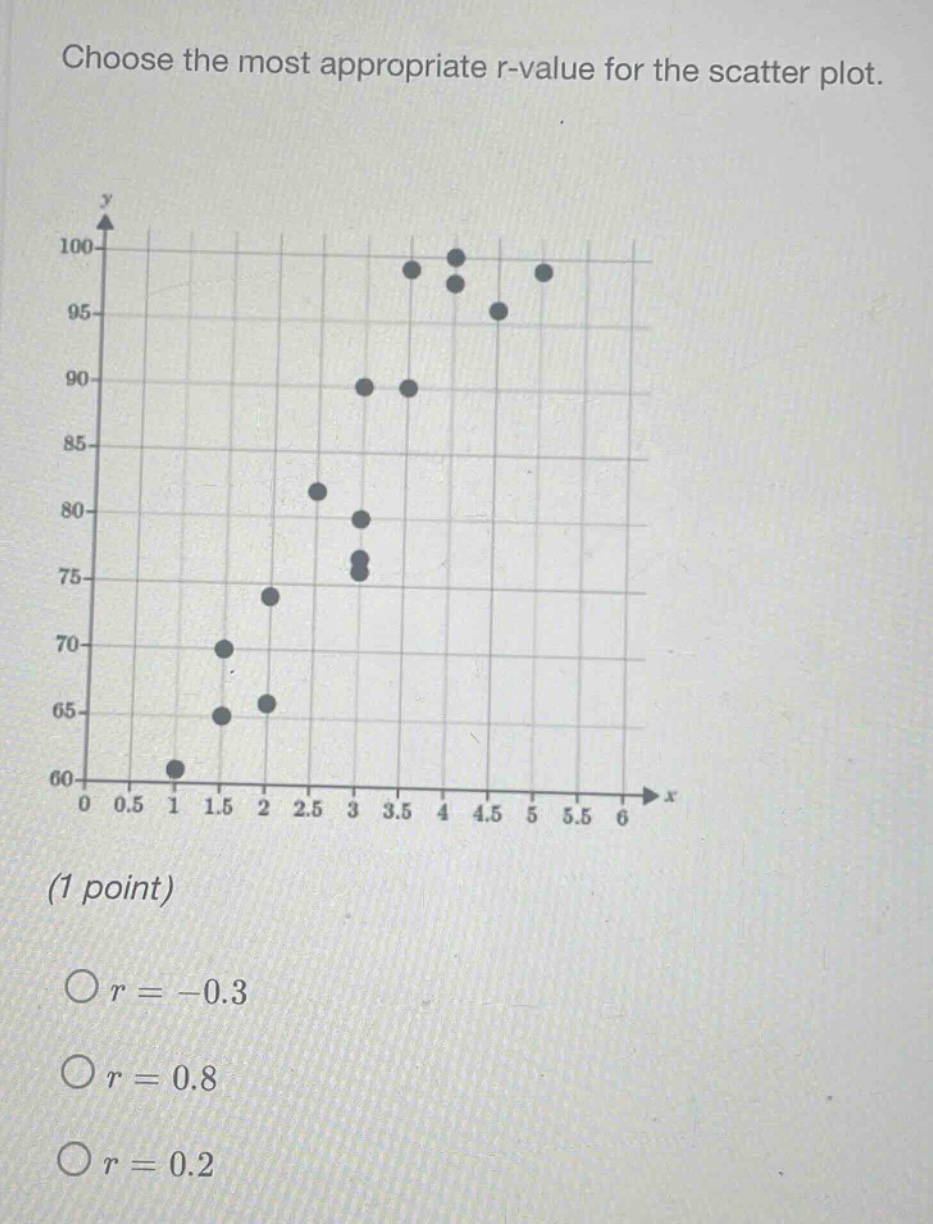
choose the most appropriate r - value for the scatter plot. (1 point) o r = -0.3 o r = 0.8 o r = 0.2
Answer
Explanation:
Step1: Observe scatter - plot trend
The points in the scatter - plot show an upward trend, so the correlation coefficient (r>0).
Step2: Assess strength of correlation
The points are somewhat clustered around an upward - sloping line, indicating a moderately strong positive correlation. A value of (r = 0.2) represents a weak positive correlation, (r=-0.3) is a weak negative correlation, and (r = 0.8) is a moderately strong positive correlation.
Answer:
(r = 0.8)