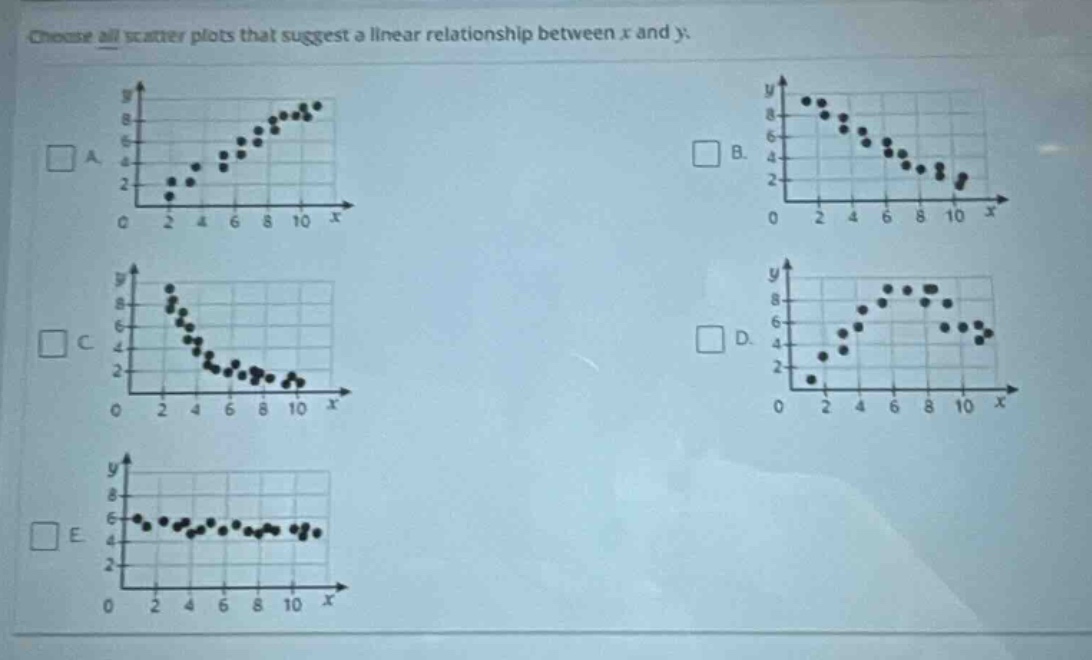
choose all scatter plots that suggest a linear relationship between x and y.
choose all scatter plots that suggest a linear relationship between x and y.
Answer
Explanation:
Step1: Understand linear - relationship concept
In a linear relationship, the data points in a scatter - plot tend to form a straight - line pattern.
Step2: Analyze Plot A
The points in Plot A seem to follow an upward - sloping straight - line pattern.
Step3: Analyze Plot B
The points in Plot B seem to follow a downward - sloping straight - line pattern.
Step4: Analyze Plot C
The points in Plot C seem to follow a downward - sloping straight - line pattern.
Step5: Analyze Plot D
The points in Plot D form a curved (parabolic) pattern, not a linear one.
Step6: Analyze Plot E
The points in Plot E are scattered randomly and do not form a linear pattern.
Answer:
A. The scatter - plot in option A, B. The scatter - plot in option B, C. The scatter - plot in option C