choosing a measure of center\ncreate a dot plot of the data shown below.\n20, 21, 21, 25, 20, 23, 27, 23…
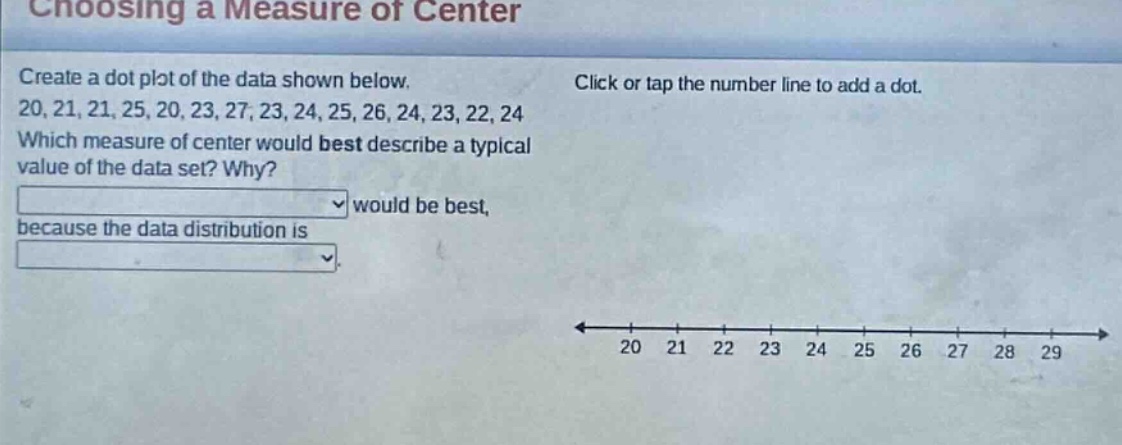
choosing a measure of center\ncreate a dot plot of the data shown below.\n20, 21, 21, 25, 20, 23, 27, 23, 24, 25, 26, 24, 23, 22, 24\nwhich measure of center would best describe a typical value of the data set? why?\nwould be best,\nbecause the data distribution is
Answer
Explanation:
Step1: Organize data frequency
Count the frequency of each value: 20 appears 2 times, 21 appears 2 times, 22 appears 1 time, 23 appears 3 times, 24 appears 3 times, 25 appears 2 times, 26 appears 1 time, 27 appears 1 time.
Step2: Analyze data distribution
The data distribution is relatively symmetric with no extreme outliers.
Step3: Select measure of center
The mean is a good measure of center for symmetric - shaped data without extreme outliers.
Answer:
The mean would be best, because the data distribution is symmetric.