choosing a measure of center\ncreate a dot plot of the data shown below.\n20, 21, 21, 25, 20, 23, 27, 23…
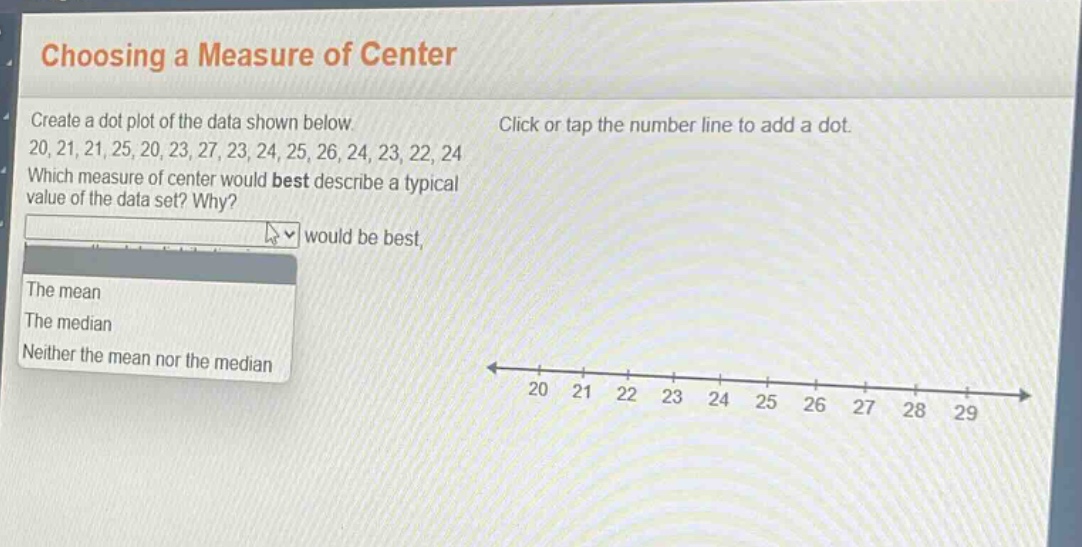
choosing a measure of center\ncreate a dot plot of the data shown below.\n20, 21, 21, 25, 20, 23, 27, 23, 24, 25, 26, 24, 23, 22, 24\nwhich measure of center would best describe a typical value of the data set? why?\nthe mean\nthe median\nneither the mean nor the median
Answer
Explanation:
Step1: Organize data
First, order the data: 20, 20, 21, 21, 22, 23, 23, 23, 24, 24, 24, 25, 25, 26, 27.
Step2: Check for outliers
There are no extreme - value outliers in this data set.
Step3: Analyze measures of center
The mean takes into account all values in the data set and gives an average value. Since there are no outliers to skew the data, the mean will give a good representation of the typical value. The median is also a good measure, but when there are no outliers, the mean is often preferred as it uses all data points in its calculation.
Answer:
The mean