in a class of 20 students, 2 students have a grade of d, 8 students have a grade of c, 6 students have a…
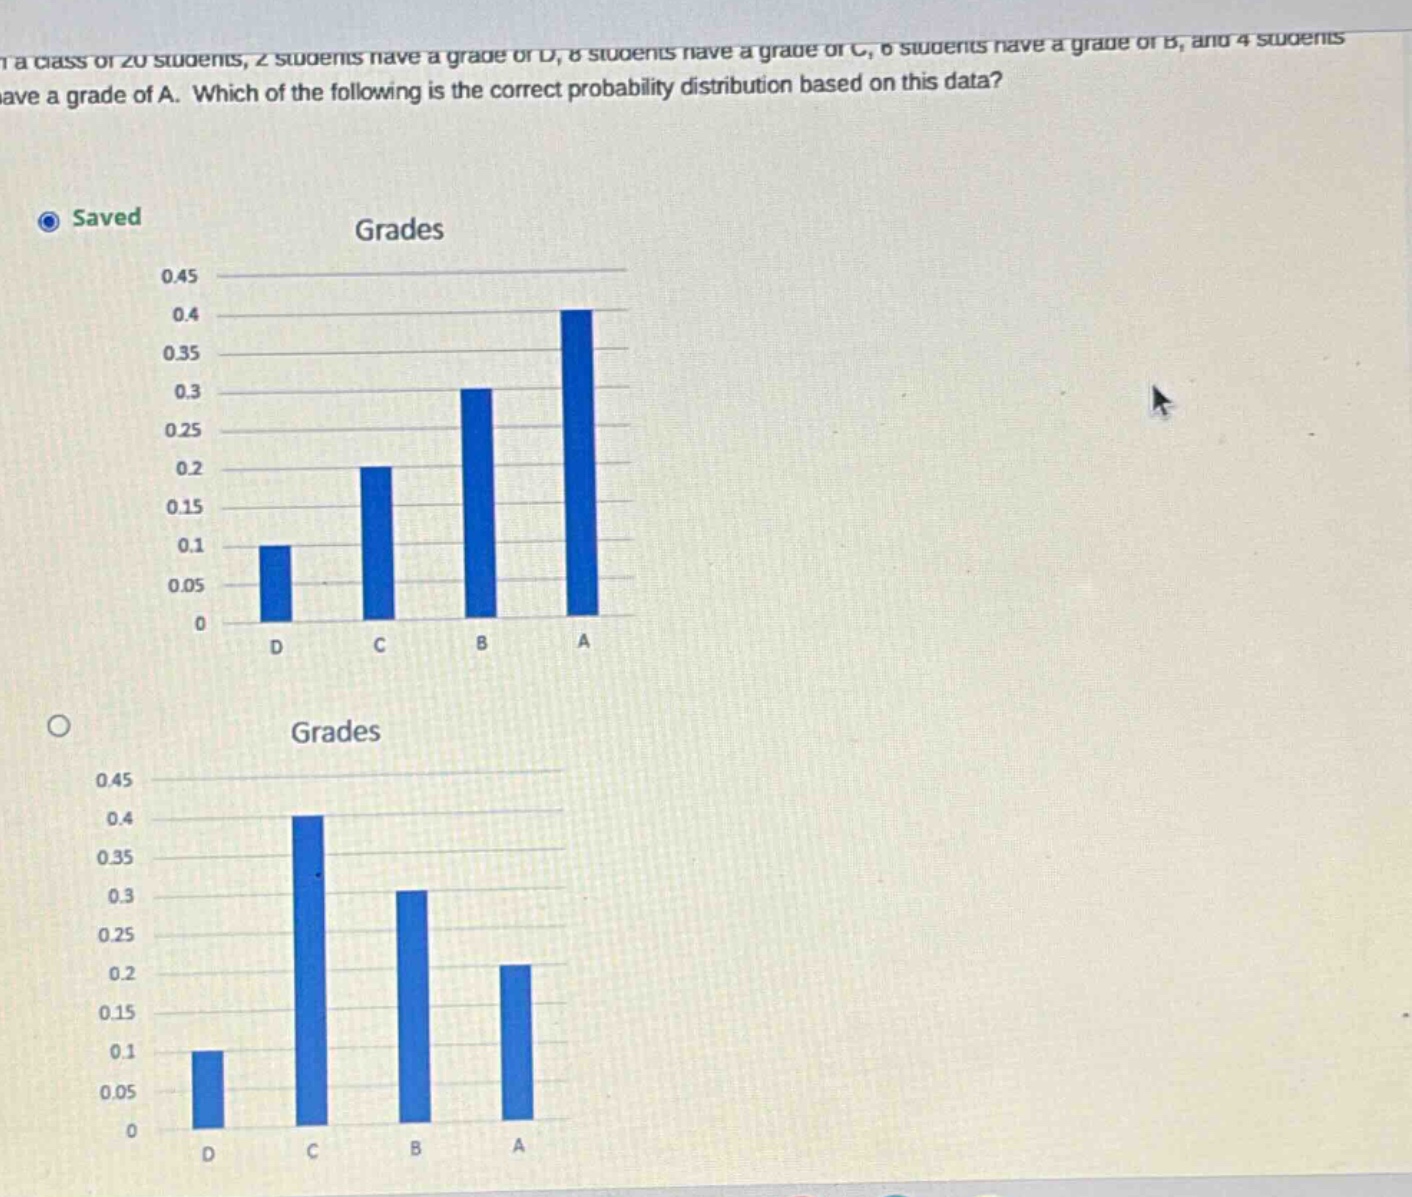
in a class of 20 students, 2 students have a grade of d, 8 students have a grade of c, 6 students have a grade of b, and 4 students have a grade of a. which of the following is the correct probability distribution based on this data?
Answer
Explanation:
Step1: Calculate total number of students
$2 + 8+6 + 4=20$
Step2: Calculate probability of grade D
$P(D)=\frac{2}{20}=0.1$
Step3: Calculate probability of grade C
$P(C)=\frac{8}{20}=0.4$
Step4: Calculate probability of grade B
$P(B)=\frac{6}{20}=0.3$
Step5: Calculate probability of grade A
$P(A)=\frac{4}{20}=0.2$
Answer:
The correct probability - distribution has probabilities 0.1 for D, 0.4 for C, 0.3 for B and 0.2 for A. So the bar - chart with these heights for D, C, B and A respectively is the correct one. Without seeing the full options clearly (since the image has some issues), but based on calculations, the bar for D should be at 0.1, C at 0.4, B at 0.3 and A at 0.2 on the vertical axis.