click the arrows to choose an answer from each menu. the line y = 10x choose... a good line of fit for the…
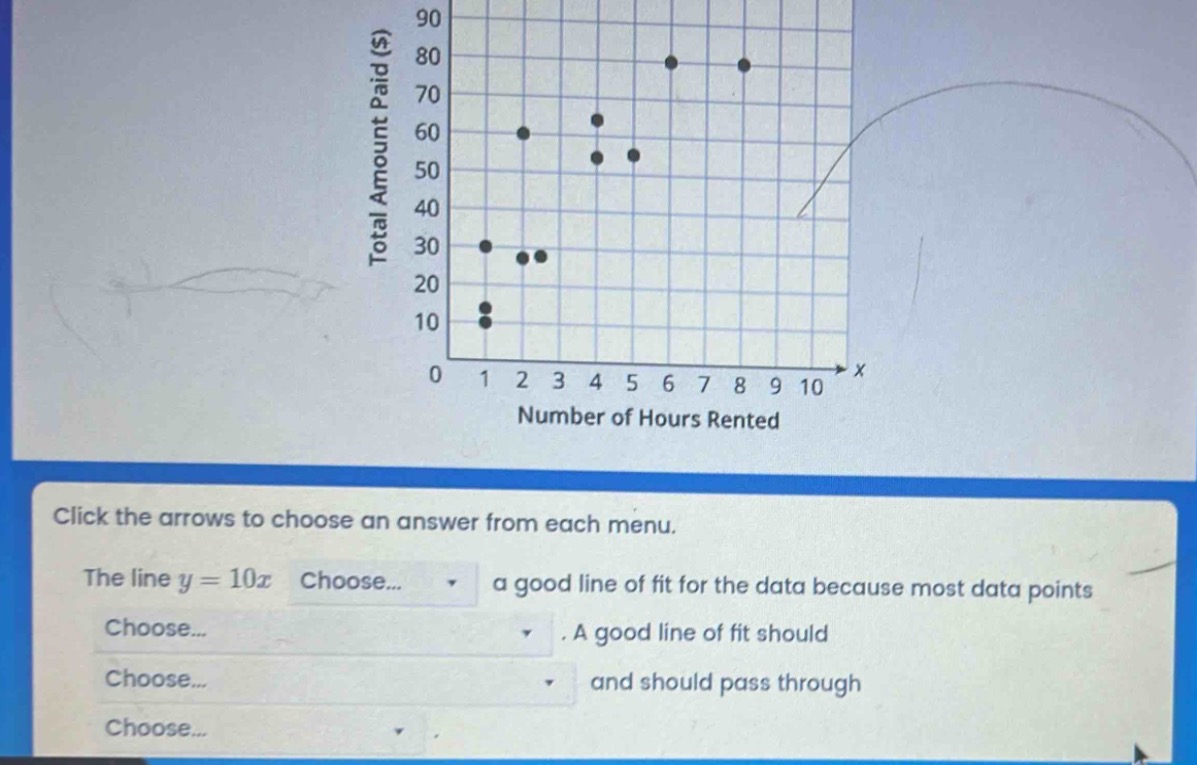
click the arrows to choose an answer from each menu. the line y = 10x choose... a good line of fit for the data because most data points choose... a good line of fit should choose... and should pass through choose...
Answer
Explanation:
Step1: Analyze line - data relationship
The line $y = 10x$ is compared with the data points on the scatter - plot.
Step2: Check line of fit criteria
A good line of fit should be as close as possible to most data points and should pass through the "center" of the data distribution. Looking at the scatter - plot, most data points are not close to the line $y = 10x$.
Answer:
is not; are not close to the line; be as close as possible to most data points; the "center" of the data distribution