the coach of darnels baseball team recorded how many runs the team scored in each game last season. this box…
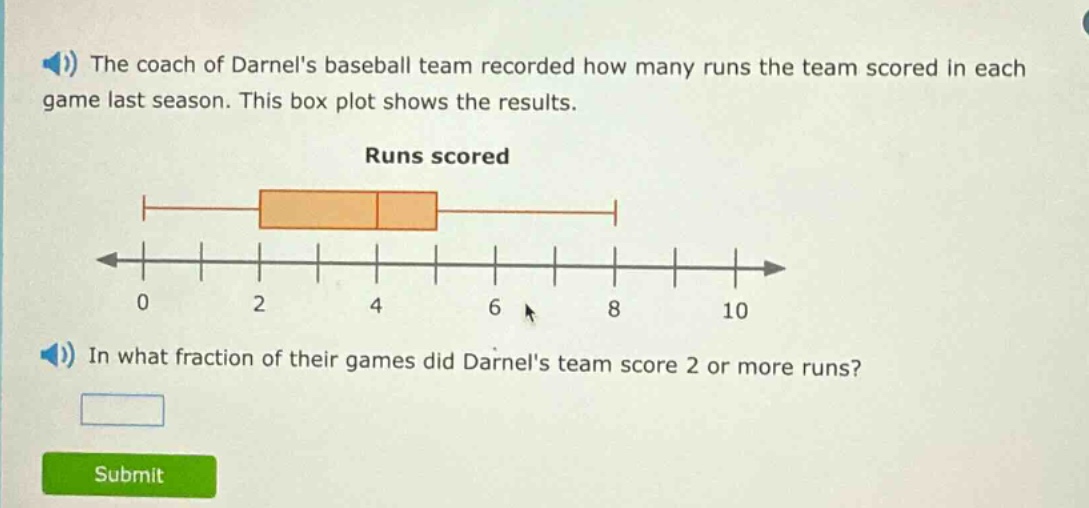
the coach of darnels baseball team recorded how many runs the team scored in each game last season. this box plot shows the results. runs scored in what fraction of their games did darnels team score 2 or more runs?
Answer
Explanation:
Step1: Understand box - plot quartiles
A box - plot divides data into quartiles. The left - most part of the box (the lower quartile, Q1) is at 2.
Step2: Calculate the fraction
The total number of data points is considered as 4 quartiles. The number of quartiles representing scores of 2 or more runs is 3 (Q1, Q2, Q3 and the upper whisker). So the fraction is $\frac{3}{4}$.
Answer:
$\frac{3}{4}$