coach rivers recorded the number of points each player on the basketball team scored in their first few…
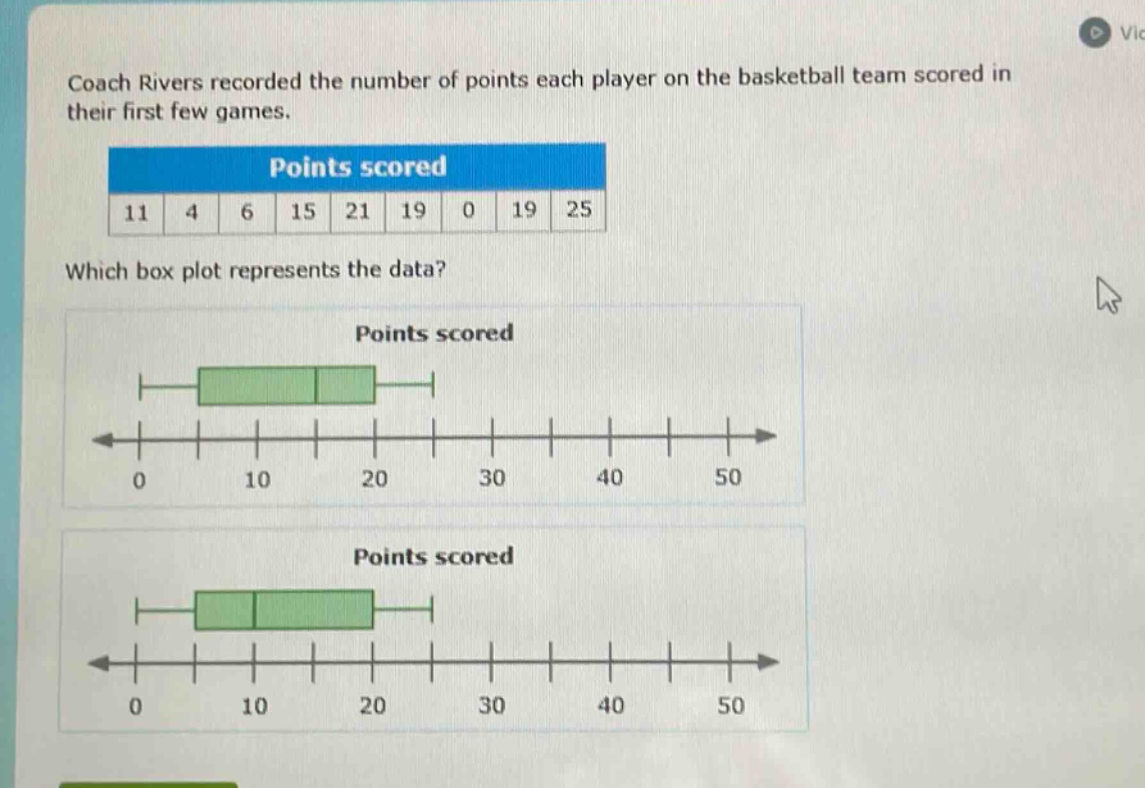
coach rivers recorded the number of points each player on the basketball team scored in their first few games.\npoints scored\n11 4 6 15 21 19 0 19 25\nwhich box plot represents the data?\npoints scored\npoints scored
Answer
Explanation:
Step1: Arrange data in ascending order
$0,4,6,11,15,19,19,21,25$
Step2: Find the median (Q2)
There are 9 data - points. The median is the 5th value. So, $Q2 = 15$.
Step3: Find the lower half of data
The lower half is $0,4,6,11$. The median of the lower half (Q1) is $\frac{4 + 6}{2}=5$.
Step4: Find the upper half of data
The upper half is $19,19,21,25$. The median of the upper half (Q3) is $\frac{19+21}{2}=20$.
Step5: Identify the minimum and maximum
The minimum value is $0$ and the maximum value is $25$.
A box - plot has a box from Q1 to Q3 with a line at Q2 inside the box. The whiskers extend from the box to the minimum and maximum values.
The box should start at $5$ (Q1), end at $20$ (Q3), have a line at $15$ (Q2) inside the box, and whiskers from $0$ to $25$.
Answer:
We need to check the box - plots to see which one has a box starting at 5, ending at 20, a line at 15 inside the box, and whiskers from 0 to 25. Without seeing the full options clearly, based on the calculated values, the box - plot with these characteristics is the correct one. If we assume the first box - plot has these correct quartile and extreme values, then that is the answer. But in a complete scenario, we would match these values to the actual box - plots provided.