coaches of 15 high school basketball teams were asked to record the amount of time, in minutes, their teams…
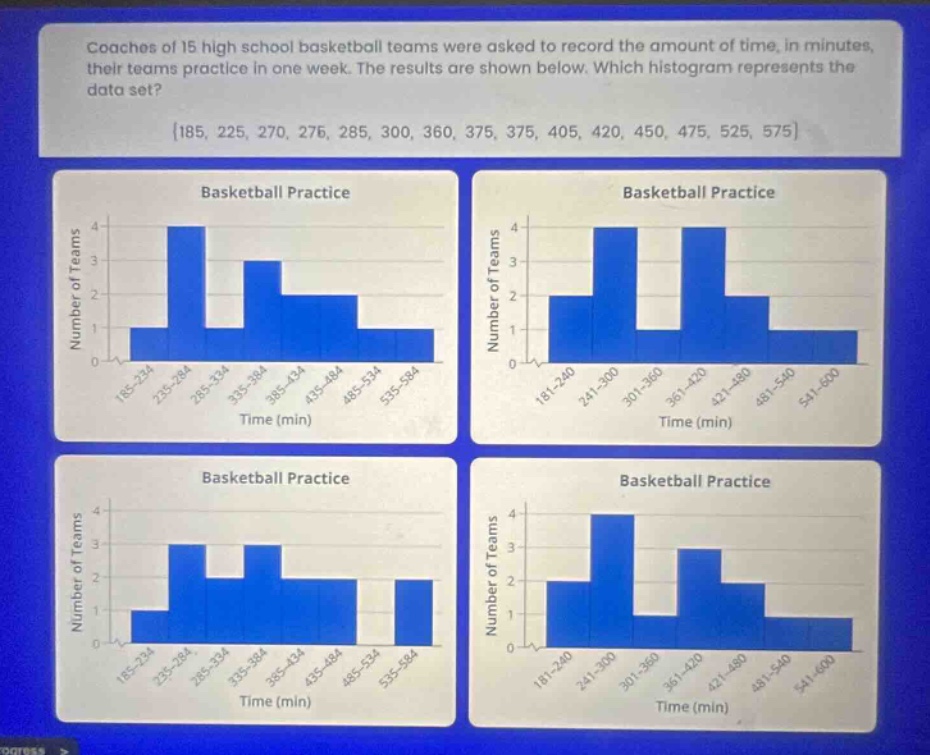
coaches of 15 high school basketball teams were asked to record the amount of time, in minutes, their teams practice in one week. the results are shown below. which histogram represents the data set? {185, 225, 270, 275, 285, 300, 360, 375, 375, 405, 420, 450, 475, 525, 575}
Answer
Explanation:
Step1: Count data in intervals
For the first histogram with intervals 185 - 234, 235 - 284, 285 - 334, 335 - 384, 385 - 434, 435 - 484, 485 - 534, 535 - 584:
- In the interval 185 - 234: There are 2 values (185, 225)
- In the interval 235 - 284: There are 2 values (270, 276)
- In the interval 285 - 334: There are 1 value (285)
- In the interval 335 - 384: There are 2 values (360, 375)
- In the interval 385 - 434: There are 2 values (405, 420)
- In the interval 435 - 484: There are 2 values (450, 475)
- In the interval 485 - 534: There are 1 value (525)
- In the interval 535 - 584: There are 1 value (575)
Step2: Match with histograms
By comparing the frequency of data in each interval with the heights of the bars in the histograms, we can find the correct one. The first histogram correctly represents the frequency - distribution of the given data set.
Answer:
The first histogram (top - left) represents the data set.