the coaches determined the mean and mad from the raw data and used that information to compare the two…
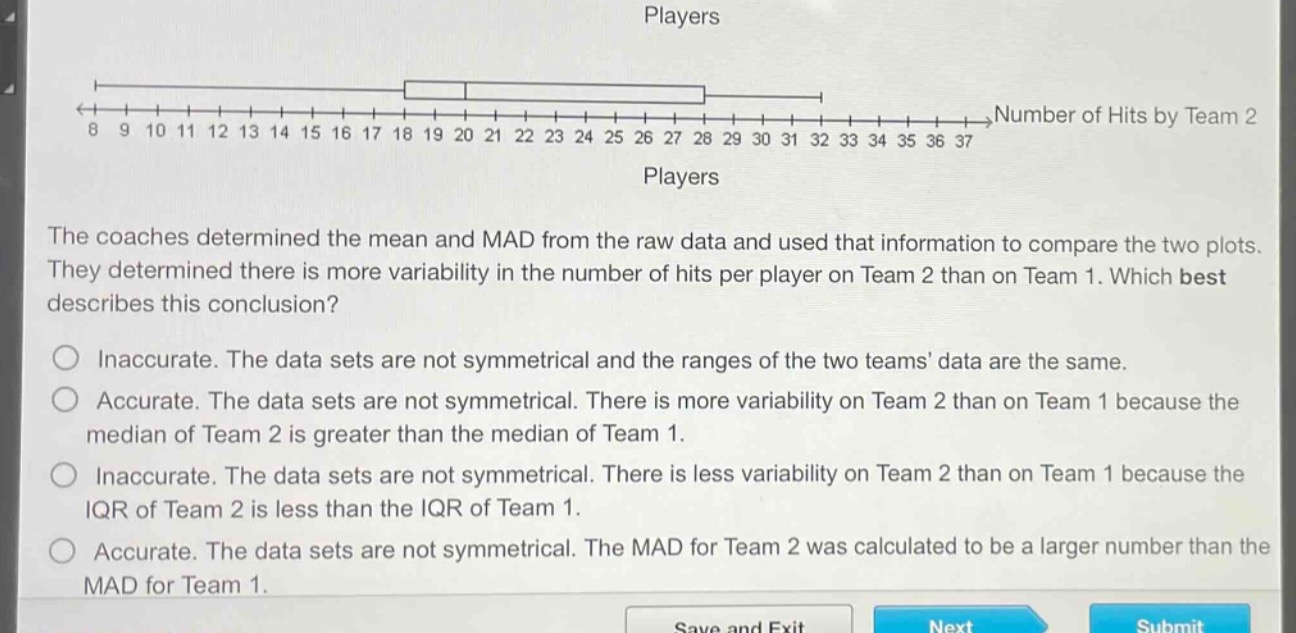
the coaches determined the mean and mad from the raw data and used that information to compare the two plots. they determined there is more variability in the number of hits per player on team 2 than on team 1. which best describes this conclusion? inaccurate. the data sets are not symmetrical and the ranges of the two teams data are the same. accurate. the data sets are not symmetrical. there is more variability on team 2 than on team 1 because the median of team 2 is greater than the median of team 1. inaccurate. the data sets are not symmetrical. there is less variability on team 2 than on team 1 because the iqr of team 2 is less than the iqr of team 1. accurate. the data sets are not symmetrical. the mad for team 2 was calculated to be a larger number than the mad for team 1.
Answer
Brief Explanations:
The Mean - Absolute - Deviation (MAD) measures the variability in a data - set. A larger MAD indicates more variability. Since the coaches calculated a larger MAD for Team 2 than for Team 1, it is accurate to say there is more variability in the number of hits per player on Team 2. Symmetry of the data and median values are not relevant to the conclusion based on MAD. The inter - quartile range (IQR) is not mentioned in the coaches' method of comparison here.
Answer:
Accurate. The data sets are not symmetrical. The MAD for Team 2 was calculated to be a larger number than the MAD for Team 1.