a college student would like to investigate the prices of sandwiches offered near the campus. a sample of 50…
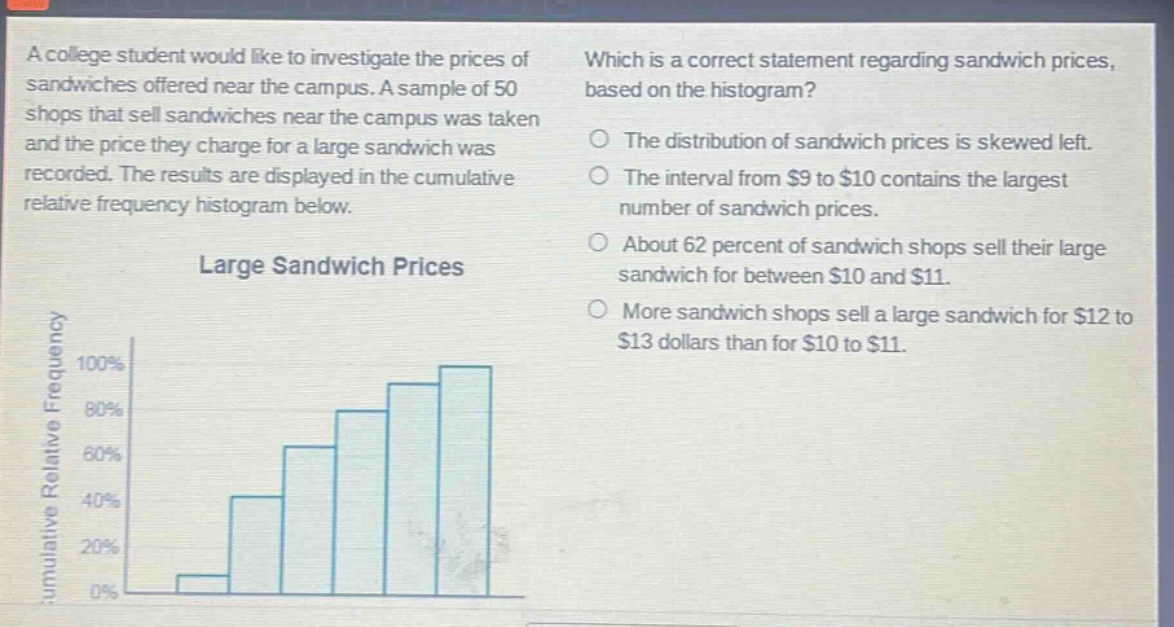
a college student would like to investigate the prices of sandwiches offered near the campus. a sample of 50 shops that sell sandwiches near the campus was taken and the price they charge for a large sandwich was recorded. the results are displayed in the cumulative relative frequency histogram below. large sandwich prices which is a correct statement regarding sandwich prices, based on the histogram? the distribution of sandwich prices is skewed left. the interval from $9 to $10 contains the largest number of sandwich prices. about 62 percent of sandwich shops sell their large sandwich for between $10 and $11. more sandwich shops sell a large sandwich for $12 to $13 dollars than for $10 to $11.
Answer
Explanation:
Step1: Analyze skewness
The histogram shows a right - skewed distribution (tail on the right), not left - skewed. So the first option is incorrect.
Step2: Check frequency in intervals
The steepest part of the cumulative relative frequency histogram indicates the interval with the largest number of data points. The interval from $9 - 10$ has the largest increase in cumulative relative frequency, meaning it contains the largest number of sandwich prices.
Step3: Analyze percentage in $10 - 11$ interval
We cannot say that about 62 percent of sandwich shops sell their large sandwich for between $10$ and $11$ as there is no evidence from the cumulative relative frequency histogram to support this exact percentage.
Step4: Compare frequencies in intervals
The cumulative relative frequency for $10 - 11$ is higher than for $12 - 13$, so more shops sell in the $10 - 11$ interval, not the other way around.