a college student would like to investigate the prices of sandwiches offered near the campus. a sample of 50…
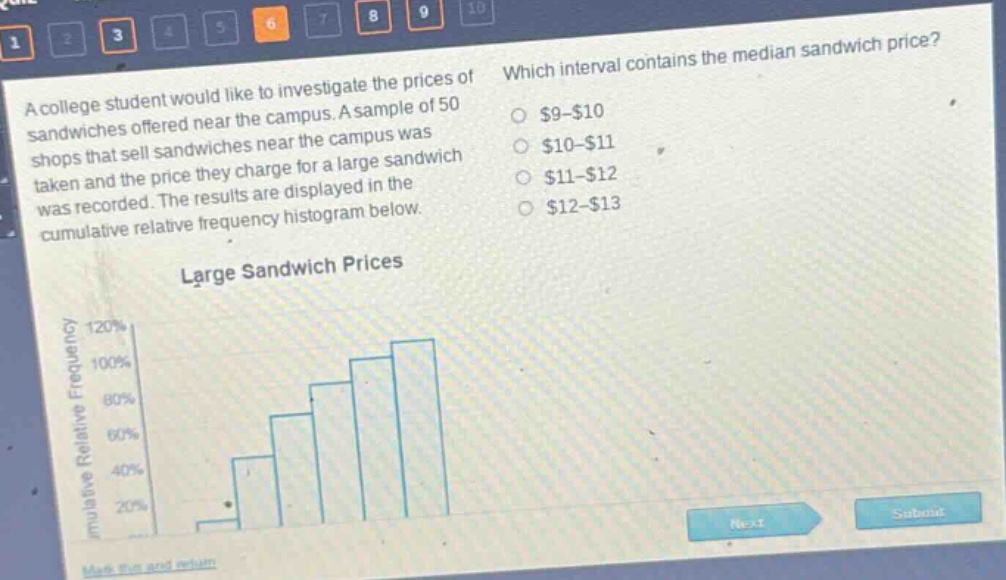
a college student would like to investigate the prices of sandwiches offered near the campus. a sample of 50 shops that sell sandwiches near the campus was taken and the price they charge for a large sandwich was recorded. the results are displayed in the cumulative relative frequency histogram below. which interval contains the median sandwich price? $9 - $10 $10 - $11 $11 - $12 $12 - $13 large sandwich prices
Answer
Explanation:
Step1: Determine the position of the median
For a sample size $n = 50$, the median position is $\frac{n+1}{2}=\frac{50 + 1}{2}=25.5$. So the median is the average of the 25th and 26th - ordered data values.
Step2: Read from the cumulative - relative frequency histogram
We know that the cumulative - relative frequency represents the proportion of data values less than or equal to a certain value. We need to find the interval where the 25th and 26th values fall. Since the sample size is 50, we look for the interval where the cumulative - relative frequency passes 50% (because the median divides the data into two equal - sized halves). Looking at the cumulative - relative frequency histogram, when we move from left to right, the cumulative - relative frequency passes 50% in the $$10-$11$ interval.
Answer:
$10 - 11$ dollars