compare the pair of data displays. tell whether the display is skewed left, skewed right, or symmetric.\nin…
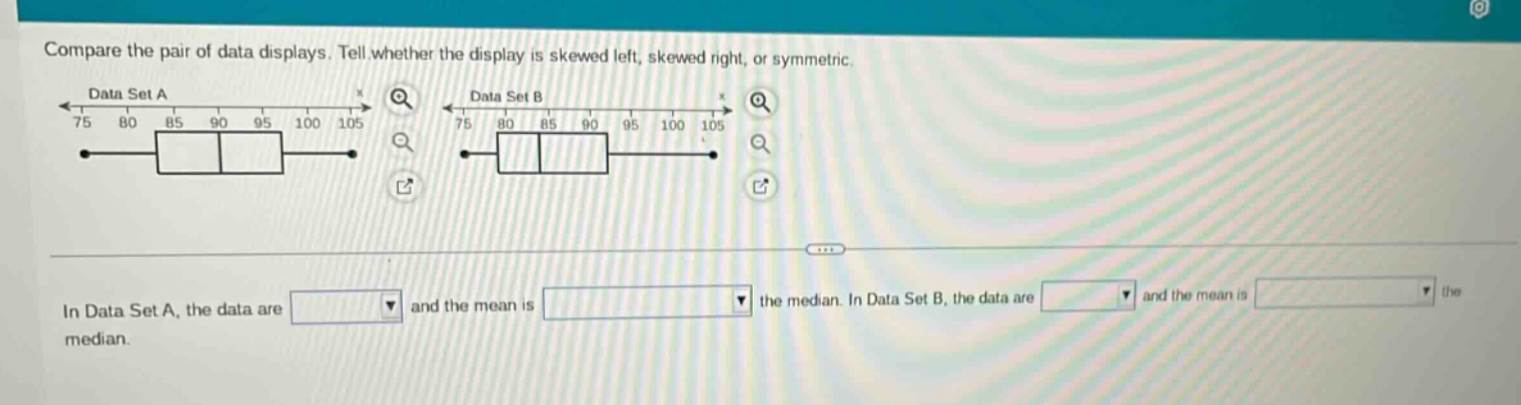
compare the pair of data displays. tell whether the display is skewed left, skewed right, or symmetric.\nin data set a, the data are and the mean is the median. in data set b, the data are and the mean is the median.
Answer
Answer:
In Data Set A, the data are symmetric and the mean is equal to the median. In Data Set B, the data are skewed right and the mean is greater than the median.
Explanation:
Step1: Analyze Data Set A box - plot
The box - plot of Data Set A is evenly balanced around the median. The whiskers are of approximately equal length on both sides and the box is symmetrically divided by the median line. So, it is symmetric. In a symmetric distribution, mean = median.
Step2: Analyze Data Set B box - plot
The box - plot of Data Set B has a longer right - hand whisker and the median is closer to the lower quartile. This indicates a right - skewed distribution. In a right - skewed distribution, the mean is pulled in the direction of the tail (right - hand side), so mean > median.