compare the two data sets. which statements are correct? data set 1: {19, 27, 19, 24, 21, 20, 23, 29, 25…
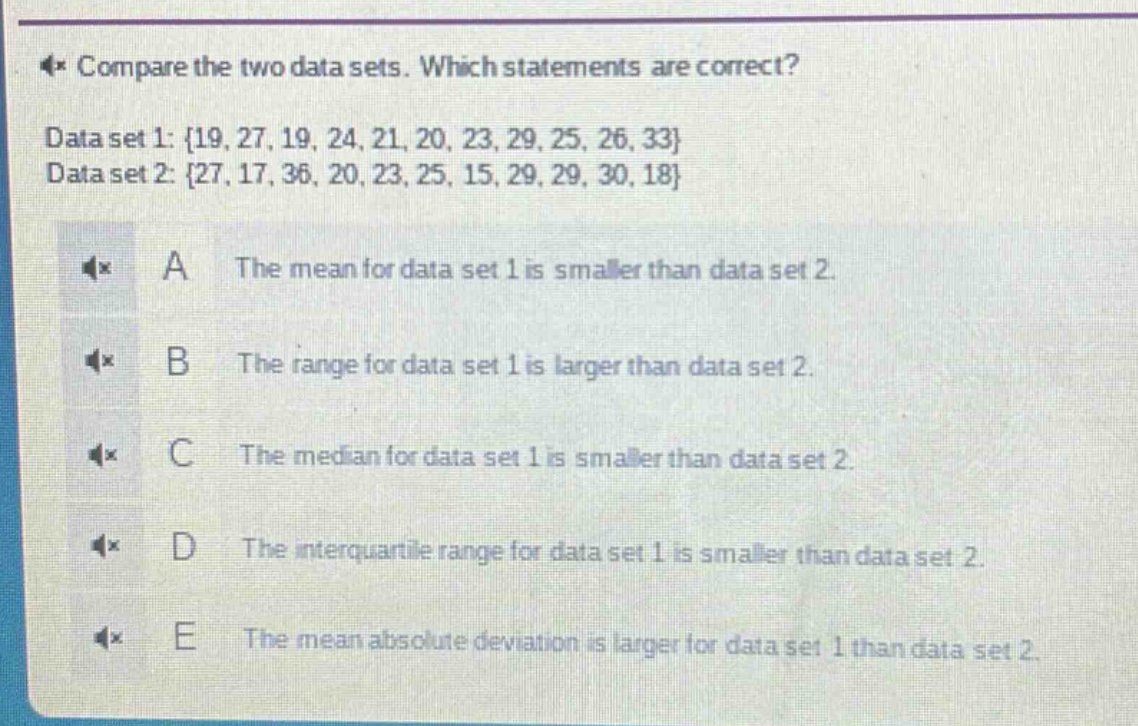
compare the two data sets. which statements are correct? data set 1: {19, 27, 19, 24, 21, 20, 23, 29, 25, 26, 33} data set 2: {27, 17, 36, 20, 23, 25, 15, 29, 29, 30, 18} a the mean for data set 1 is smaller than data set 2. b the range for data set 1 is larger than data set 2. c the median for data set 1 is smaller than data set 2. d the interquartile range for data set 1 is smaller than data set 2. e the mean absolute deviation is larger for data set 1 than data set 2.
Answer
Explanation:
Step1: Calculate the mean of data - set 1
The mean $\bar{x}_1$ of data - set 1 ${19,27,19,24,21,20,23,29,25,26,33}$ is $\bar{x}_1=\frac{19 + 27+19+24+21+20+23+29+25+26+33}{11}=\frac{266}{11}\approx24.18$.
Step2: Calculate the mean of data - set 2
The mean $\bar{x}_2$ of data - set 2 ${27,17,36,20,23,25,15,29,29,30,18}$ is $\bar{x}_2=\frac{27 + 17+36+20+23+25+15+29+29+30+18}{11}=\frac{269}{11}\approx24.45$. So, the mean of data - set 1 is smaller than that of data - set 2.
Step3: Calculate the range of data - set 1
The range of data - set 1: $R_1=\max{19,27,19,24,21,20,23,29,25,26,33}-\min{19,27,19,24,21,20,23,29,25,26,33}=33 - 19 = 14$.
Step4: Calculate the range of data - set 2
The range of data - set 2: $R_2=\max{27,17,36,20,23,25,15,29,29,30,18}-\min{27,17,36,20,23,25,15,29,29,30,18}=36 - 15 = 21$. So, the range of data - set 1 is smaller than that of data - set 2.
Step5: Arrange data - set 1 in ascending order
Data - set 1 in ascending order: ${19,19,20,21,23,24,25,26,27,29,33}$. The median $M_1$ (the 6 - th value for $n = 11$) is $24$.
Step6: Arrange data - set 2 in ascending order
Data - set 2 in ascending order: ${15,17,18,20,23,25,27,29,29,30,36}$. The median $M_2$ (the 6 - th value for $n = 11$) is $25$. So, the median of data - set 1 is smaller than that of data - set 2.
Step7: Calculate the inter - quartile range of data - set 1
For data - set 1: $Q_1$ (the 3 - rd value) is $20$, $Q_3$ (the 9 - th value) is $27$, $IQR_1=Q_3 - Q_1=27 - 20 = 7$.
Step8: Calculate the inter - quartile range of data - set 2
For data - set 2: $Q_1$ (the 3 - rd value) is $18$, $Q_3$ (the 9 - th value) is $29$, $IQR_2=Q_3 - Q_1=29 - 18 = 11$. So, the inter - quartile range of data - set 1 is smaller than that of data - set 2.
Step9: Calculate the mean absolute deviation of data - set 1
First, find the deviations from the mean $\bar{x}1\approx24.18$: $|19 - 24.18|,|27 - 24.18|,|19 - 24.18|,\cdots,|33 - 24.18|$. The mean absolute deviation $MAD_1=\frac{\sum{i = 1}^{11}|x_{i1}-\bar{x}_1|}{11}$. $MAD_1=\frac{|19 - 24.18|+|27 - 24.18|+|19 - 24.18|+|24 - 24.18|+|21 - 24.18|+|20 - 24.18|+|23 - 24.18|+|29 - 24.18|+|25 - 24.18|+|26 - 24.18|+|33 - 24.18|}{11}$ $=\frac{5.18+2.82+5.18+0.18+3.18+4.18+1.18+4.82+0.82+1.82+8.82}{11}=\frac{38.38}{11}\approx3.49$.
Step10: Calculate the mean absolute deviation of data - set 2
First, find the deviations from the mean $\bar{x}2\approx24.45$: $|27 - 24.45|,|17 - 24.45|,|36 - 24.45|,\cdots,|18 - 24.45|$. $MAD_2=\frac{\sum{i = 1}^{11}|x_{i2}-\bar{x}_2|}{11}$ $=\frac{|27 - 24.45|+|17 - 24.45|+|36 - 24.45|+|20 - 24.45|+|23 - 24.45|+|25 - 24.45|+|15 - 24.45|+|29 - 24.45|+|29 - 24.45|+|30 - 24.45|+|18 - 24.45|}{11}$ $=\frac{2.55+7.45+11.55+4.45+1.45+0.55+9.45+4.55+4.55+5.55+6.45}{11}=\frac{58.1}{11}\approx5.28$. So, the mean absolute deviation of data - set 1 is smaller than that of data - set 2.
Answer:
A. The mean for data set 1 is smaller than data set 2. C. The median for data set 1 is smaller than data set 2. D. The interquartile range for data set 1 is smaller than data set 2.