compare the wait times in the box plots. the median wait time for speed slide is 2 minutes longer than the…
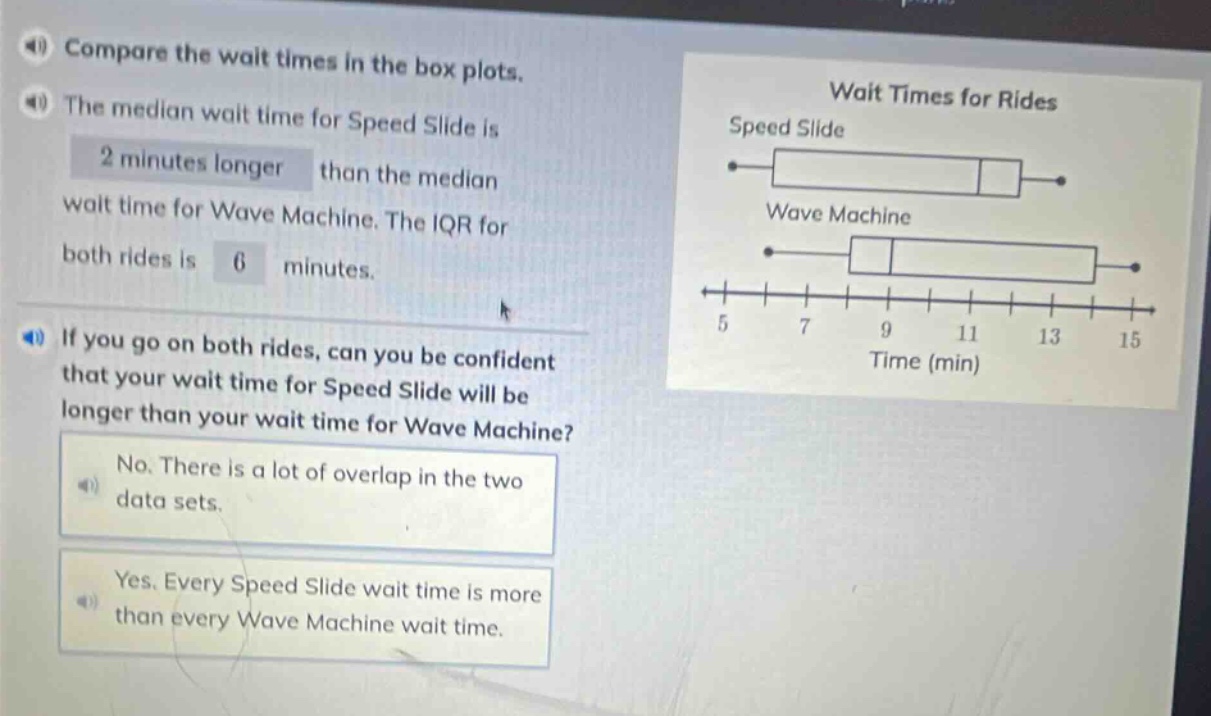
compare the wait times in the box plots. the median wait time for speed slide is 2 minutes longer than the median wait time for wave machine. the iqr for both rides is 6 minutes. if you go on both rides, can you be confident that your wait time for speed slide will be longer than your wait time for wave machine? no. there is a lot of overlap in the two data sets. yes. every speed slide wait time is more than every wave machine wait time.
Answer
Explanation:
Step1: Analyze box - plots
By observing the box - plots, we see that there is overlap between the wait - time distributions of Speed Slide and Wave Machine.
Step2: Evaluate confidence in wait - time comparison
Just because the median of Speed Slide is 2 minutes longer than that of Wave Machine and the IQRs are the same, we cannot be sure that the wait time for Speed Slide will be longer for an individual going on both rides due to the data overlap.
Answer:
No. There is a lot of overlap in the two data sets.