comparing relationships between two sets of data\namy and laura recorded the average gas mileage (mpg) of…
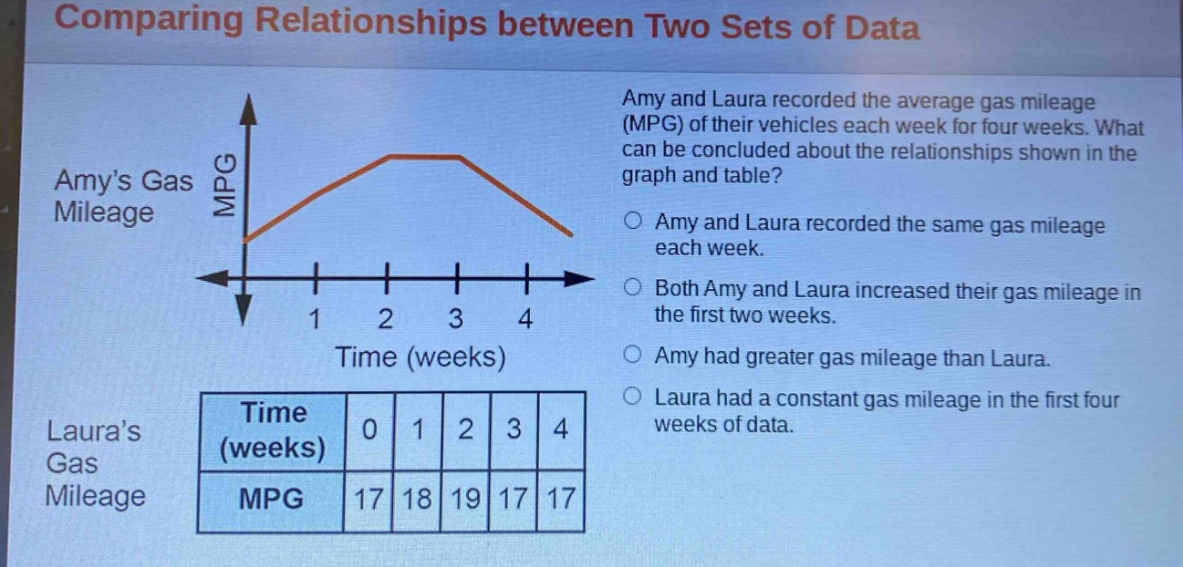
comparing relationships between two sets of data\namy and laura recorded the average gas mileage (mpg) of their vehicles each week for four weeks. what can be concluded about the relationships shown in the graph and table?\namys gas mileage\ntime (weeks)\nlauras gas mileage\ntime (weeks) 0 1 2 3 4\nmpg 17 18 19 17 17\namy and laura recorded the same gas mileage each week.\nboth amy and laura increased their gas mileage in the first two weeks.\namy had greater gas mileage than laura.\nlaura had a constant gas mileage in the first four weeks of data.
Answer
Explanation:
Step1: Analyze Amy's graph
Amy's gas - mileage graph shows an increase from week 0 to week 2 or 3 and then a decrease.
Step2: Analyze Laura's table
Laura's gas - mileage values are 17, 18, 19, 17, 17. It increases from week 0 to week 2 and then decreases.
Step3: Check each option
- Option 1: Amy and Laura did not record the same gas - mileage each week.
- Option 2: From the graph and table, both Amy and Laura increased their gas - mileage in the first two weeks.
- Option 3: We don't have enough information to compare Amy's and Laura's gas - mileage values directly across all weeks.
- Option 4: Laura did not have a constant gas - mileage in the first four weeks as it changed from 17 to 18 to 19 and then back to 17.
Answer:
Both Amy and Laura increased their gas mileage in the first two weeks.