comparing tables of data\nwhich table shows a positive correlation?
comparing tables of data\nwhich table shows a positive correlation?
Answer
Explanation:
Step1: Understand positive correlation
Positive correlation means as (x) increases, (y) also increases.
Step2: Analyze the first table
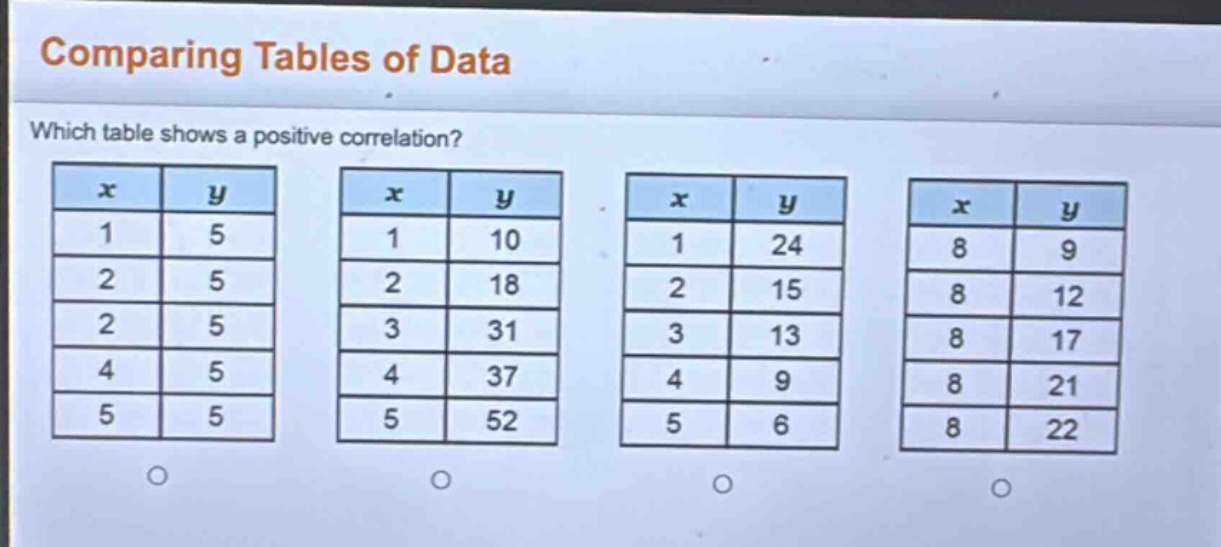
In the first table, (x) increases ((1,2,4,5)) but (y = 5) remains constant. So, no positive correlation.
Step3: Analyze the second table
When (x = 1,y = 10); (x=2,y = 18); (x = 3,y=31); (x = 4,y = 37); (x=5,y = 52). As (x) increases ((1\to2\to3\to4\to5)), (y) increases ((10\to18\to31\to37\to52)).
Step4: Analyze the third table
As (x) increases ((1\to2\to3\to4\to5)), (y) decreases ((24\to15\to13\to9\to6)). So, negative correlation.
Step5: Analyze the fourth table
(x = 8) is constant. There is no change in (x) to observe a correlation with (y).
Answer:
The second table.