comparing tables of data\nwhich table shows a positive correlation?\n| x | y |\n|----|----|\n| 1 | 5 |\n| 2…
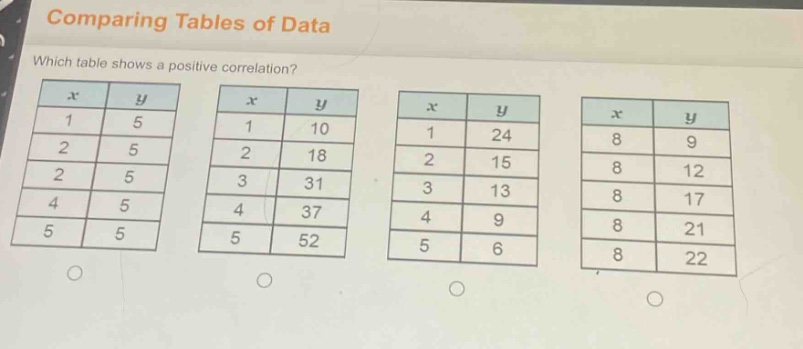
comparing tables of data\nwhich table shows a positive correlation?\n| x | y |\n|----|----|\n| 1 | 5 |\n| 2 | 5 |\n| 2 | 5 |\n| 4 | 5 |\n| 5 | 5 |\n| x | y |\n|----|----|\n| 1 | 10 |\n| 2 | 18 |\n| 3 | 31 |\n| 4 | 37 |\n| 5 | 52 |\n| x | y |\n|----|----|\n| 1 | 24 |\n| 2 | 15 |\n| 3 | 13 |\n| 4 | 9 |\n| 5 | 6 |\n| x | y |\n|----|----|\n| 8 | 9 |\n| 8 | 12 |\n| 8 | 17 |\n| 8 | 21 |\n| 8 | 22 |
Answer
Answer:
The second table (with values: $x = 1,y = 10;x = 2,y = 18;x = 3,y = 31;x = 4,y = 37;x = 5,y = 52$)
Explanation:
Step1: Define positive correlation
Positive correlation means as $x$ increases, $y$ also increases.
Step2: Analyze first table
For $x$ values $1,2,4,5$, $y$ is constantly $5$. No increase in $y$ as $x$ changes.
Step3: Analyze second table
As $x$ goes from $1$ to $2$ to $3$ to $4$ to $5$, $y$ goes from $10$ to $18$ to $31$ to $37$ to $52$. $y$ increases as $x$ increases.
Step4: Analyze third table
As $x$ increases from $1$ to $2$ to $3$ to $4$ to $5$, $y$ decreases from $24$ to $15$ to $13$ to $9$ to $6$. It's a negative - correlation.
Step5: Analyze fourth table
$x$ is constantly $8$, so there is no relationship based on change in $x$ to determine correlation.