a computer store sells ultra fast brand desktop and laptop computers. they tracked the sales of both kinds…
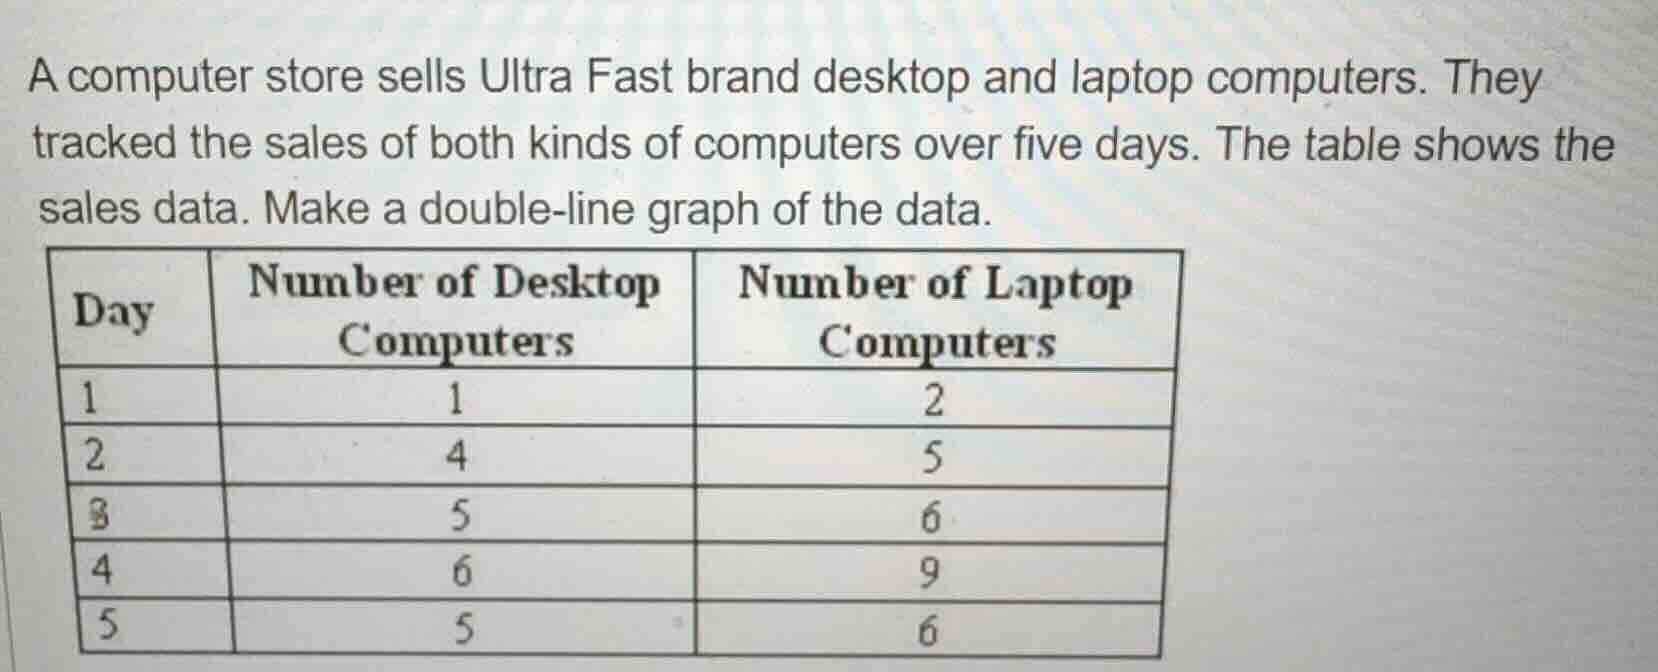
a computer store sells ultra fast brand desktop and laptop computers. they tracked the sales of both kinds of computers over five days. the table shows the sales data. make a double-line graph of the data.\n\n| day | number of desktop computers | number of laptop computers |\n| :--- | :--- | :--- |\n| 1 | 1 | 2 |\n| 2 | 4 | 5 |\n| 3 | 5 | 6 |\n| 4 | 6 | 9 |\n| 5 | 5 | 6 |
Answer
Explanation:
Step1: Identify the axes
The x-axis represents the "Day" (1 to 5), and the y-axis represents the "Number of Computers" (0 to 10).
Step2: Plot Desktop data points
Plot points for Desktop: $(1, 1), (2, 4), (3, 5), (4, 6), (5, 5)$. Connect these with a solid line.
Step3: Plot Laptop data points
Plot points for Laptop: $(1, 2), (2, 5), (3, 6), (4, 9), (5, 6)$. Connect these with a dashed line.
Step4: Finalize the graph
Add a title "Ultra Fast Computer Sales" and a legend to distinguish between Desktop and Laptop lines.
Answer:
To create the double-line graph, follow these coordinates:
| Day | Desktop (Line 1) | Laptop (Line 2) |
|---|---|---|
| 1 | 1 | 2 |
| 2 | 4 | 5 |
| 3 | 5 | 6 |
| 4 | 6 | 9 |
| 5 | 5 | 6 |
The graph should feature two distinct lines plotted against the days on the horizontal axis and the quantity sold on the vertical axis.