computing residuals from a graph. use the scatterplot and line of best fit shown to complete the statements…
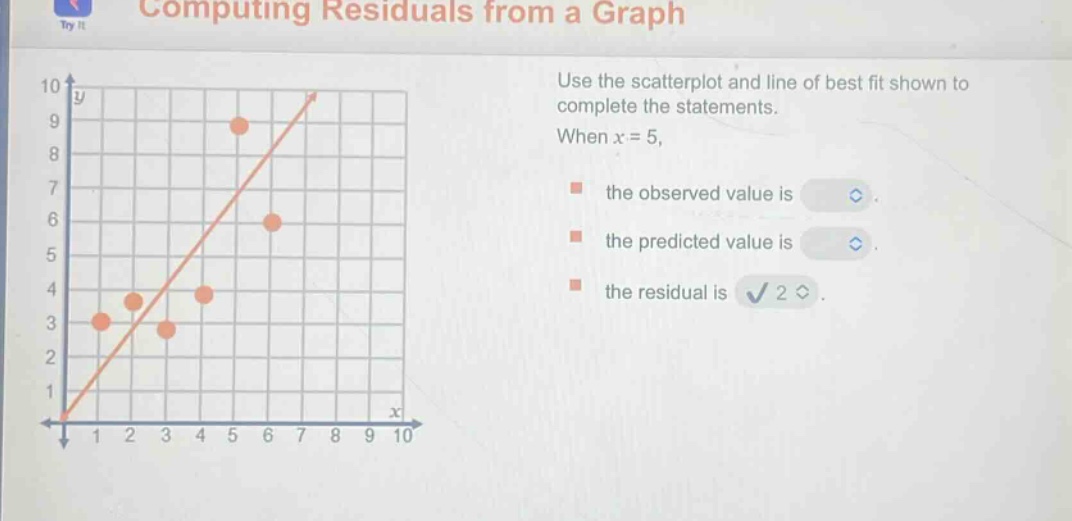
computing residuals from a graph. use the scatterplot and line of best fit shown to complete the statements. when x = 5, the observed value is, the predicted value is, the residual is.
Answer
Explanation:
Step1: Find observed value
Locate $x = 5$ on the scatter - plot. The $y$-value of the data point at $x = 5$ is 6.
Step2: Find predicted value
Locate $x = 5$ on the line of best - fit. The $y$-value of the line of best - fit at $x = 5$ is 4.
Step3: Calculate residual
Residual = Observed value - Predicted value. So, Residual=$6 - 4=2$.
Answer:
The observed value is 6, the predicted value is 4, the residual is 2.